CLASS OF 2025
C
1B
Declan
Spooner
Foothills Composite (HS) • AB
6' 0" • 180LBS
L/R • 16yr 10mo
Travel Team: Okotoks dawgs
6' 0" • 180LBS
L/R • 16yr 10mo
Travel Team: Okotoks dawgs
Rankings
2025 National
Rankings available to Premium Subscriber
2025 State
Rankings available to Premium Subscriber
Commitment
Best Of Stats
21.4
Hand Speed (max)
2/21/22
69
Bat Speed (max)
7/27/22
9.6
Rot. Acc (max)
7/27/22
-
Hard Hit %
95.9
Exit Velocity (max)
3/27/24
93.6
Exit Velocity (avg)
3/27/24
315
Distance (max)
3/27/24
67
Sweet Spot %
7/27/22
7.52
60
7/27/22
-
30-yd
-
10-yd
-
Run speed (max)
-
INF Velo
-
OF Velo
78
C Velo
3/28/23
1.90 - 1.91
Pop Time
3/28/23
Positional Tools
2024
2023
2022
Pop Time
The athlete's fastest pop time in the given event year. Measured from glove to glove, in seconds (s).
1.95 - 2.03
Catcher Velocity
The athlete's maximum throwing velocity from the catcher position in the given event year. Measured in miles per hour (MPH).
78.0
Pop Time
The athlete's fastest pop time in the given event year. Measured from glove to glove, in seconds (s).
1.90 - 1.91
Catcher Velocity
The athlete's maximum throwing velocity from the catcher position in the given event year. Measured in miles per hour (MPH).
78.0
60 Yard Dash
The athlete's fastest 60-yard dash time in the given event year. Measured in seconds (s)
7.52
Pop Time
The athlete's fastest pop time in the given event year. Measured from glove to glove, in seconds (s).
2.06 - 2.47
Catcher Velocity
The athlete's maximum throwing velocity from the catcher position in the given event year. Measured in miles per hour (MPH).
76.0
Power / Speed Score
A simple calculation that divides the athlete’s Exit Velocity Max by the athlete’s 60 Yard Dash time for the given event year. For example, 98 MPH / 7.00s = 14.00.
12.0
Hitting
2024
2023
2022
Exit Velocity Max
The highest exit velocity of any batted ball in the given event year. Measured in miles per hour (MPH).
95.9
Exit Velocity Avg
Average exit velocity of all batted balls in the given event year. Measured in miles per hour (MPH).
93.6
Distance Max
The highest flight distance of any batted ball in the given event year. Measured in feet (ft).
315
Distance Avg
Average flight distance of all batted balls in the given event year. Measured in feet (ft).
158
Launch Angle Avg
Average launch angle of all batted balls in the given event year. Measured in degrees.
8.3
Hard Hit %
Percentage of batted balls with exit velocities over 95 MPH in the given event year.
Sweet Spot %
Percentage of batted balls in the given event year with a launch angle between 8° and 32°.
Line Drive %
Percentage of batted balls with launch angles between 10 and 25 degrees in the given event year.
Fly Ball %
Percentage of batted balls with launch angles between 25 and 50 degrees in the given event year.
Ground Ball %
Percentage of batted balls with launch angles below 10 degrees in the given event year.
Exit Velocity Max
The highest exit velocity of any batted ball in the given event year. Measured in miles per hour (MPH).
95.0
Exit Velocity Avg
Average exit velocity of all batted balls in the given event year. Measured in miles per hour (MPH).
89.7
Distance Max
The highest flight distance of any batted ball in the given event year. Measured in feet (ft).
279
Distance Avg
Average flight distance of all batted balls in the given event year. Measured in feet (ft).
196
Launch Angle Avg
Average launch angle of all batted balls in the given event year. Measured in degrees.
13.0
Hard Hit %
Percentage of batted balls with exit velocities over 95 MPH in the given event year.
Sweet Spot %
Percentage of batted balls in the given event year with a launch angle between 8° and 32°.
Line Drive %
Percentage of batted balls with launch angles between 10 and 25 degrees in the given event year.
Fly Ball %
Percentage of batted balls with launch angles between 25 and 50 degrees in the given event year.
Ground Ball %
Percentage of batted balls with launch angles below 10 degrees in the given event year.
Exit Velocity Max
The highest exit velocity of any batted ball in the given event year. Measured in miles per hour (MPH).
90.1
Exit Velocity Avg
Average exit velocity of all batted balls in the given event year. Measured in miles per hour (MPH).
83.7
Distance Max
The highest flight distance of any batted ball in the given event year. Measured in feet (ft).
292
Distance Avg
Average flight distance of all batted balls in the given event year. Measured in feet (ft).
197
Launch Angle Avg
Average launch angle of all batted balls in the given event year. Measured in degrees.
17.3
Hard Hit %
Percentage of batted balls with exit velocities over 95 MPH in the given event year.
Sweet Spot %
Percentage of batted balls in the given event year with a launch angle between 8° and 32°.
Line Drive %
Percentage of batted balls with launch angles between 10 and 25 degrees in the given event year.
Fly Ball %
Percentage of batted balls with launch angles between 25 and 50 degrees in the given event year.
Ground Ball %
Percentage of batted balls with launch angles below 10 degrees in the given event year.
2024 Okotoks Dawgs Scout Day
Mar 27, 2024
Trackman - Hitting
95.9
Exit Velocity (max)
93.6
Exit Velocity (avg)
158
Distance (avg)
315
Distance (max)
Hard Hit %
Sweet Spot %
Line Drive %
Ground Ball %
2023 Okotoks Dawgs Scout Day
Mar 28, 2023
Trackman - Hitting
95.0
Exit Velocity (max)
89.7
Exit Velocity (avg)
196
Distance (avg)
279
Distance (max)
Hard Hit %
Sweet Spot %
Line Drive %
Fly Ball %
Ground Ball %
2022 PBR Future Games
Jul 27, 2022
Trackman - Hitting
90.1
Exit Velocity (max)
83.7
Exit Velocity (avg)
197
Distance (avg)
292
Distance (max)
Hard Hit %
Sweet Spot %
Line Drive %
Fly Ball %
Ground Ball %
Hitting
2022
Hand Speed Max
The highest Peak Hand Speed of any swing in the given event year.
21.4
Hand Speed Avg
The average Peak Hand Speed for all swings in the given event year.
19.4
Bat Speed Max
The highest Bat Speed of any swing in the given event year.
69.0
Bat Speed Avg
The average Bat Speed for all swings in the given event year.
64.7
Rotational Acceleration Max
The highest Rotational Acceleration of any swing in the given event year.
Rotational Acceleration Avg
The average Rotational Acceleration for all swings in the given event year.
On-Plane Efficiency Max
The highest On-Plane Efficiency of any swing in the given event year.
On-Plane Efficiency Avg
The average On-Plane Efficiency for all swings in the given event year.
2022 PBR Future Games
Jul 27, 2022
Blast - Hitting
20.2
Hand Speed (max)
19.1
Hand Speed (avg)
69.0
Bat Speed (max)
65.8
Bat Speed (avg)
Rot. Acc (max)
Rot. Acc (avg)
On Plane Eff (avg)
MaxOnPlaneEfficiency
The BC New Year Open - 2022
Feb 21, 2022
Blast - Hitting
21.4
Hand Speed (max)
19.7
Hand Speed (avg)
67.8
Bat Speed (max)
63.8
Bat Speed (avg)
Rot. Acc (max)
Rot. Acc (avg)
On Plane Eff (avg)
MaxOnPlaneEfficiency
Pitching
Pitch Scores
Pitching Velos
Game Performance
Visual Edge
2022
Edge Score
The highest Edge Score within the given year. Edge Score is a comprehensive score that takes the core-six visual skills into account, providing an assessment of an athlete’s overall visual ability.
76.58
Pitch Ai
Notes
News
- Okotoks Dawgs Scout Day: Statistical Analysis - Mar 30, 2024
- PBR Canada: 2025 Rankings Breakdown (AB/BC/ON) - Aug 29, 2023
- Okotoks Dawgs Scout Day: TrackMan Hitting Leaders - Apr 1, 2023
- Okotoks Dawgs Scout Day: Upperclass Quick Hits - Mar 31, 2023
- Canada's Top Uncommitted Catchers - Jan 26, 2023
- Another Successful Future Games Completed For Team Canada - Aug 8, 2022
- 2022 Future Games: Heff's Hits - Aug 8, 2022
- 2022 Future Games: Team Canada - Workout/Gameday Notes - Aug 6, 2022
- 2022 Future Games: Team Canada - Top Performers - Aug 6, 2022
- 2022 Future Games: Team Canada - Dugout Chatter - Aug 5, 2022
- 2022 Future Games: Team Canada - Top Statistical Performers - Aug 1, 2022
- 2022 Future Games: Team Canada - Meet The Team - Jul 22, 2022
- Futures Trials – A Recap of the Top Talents - Jun 27, 2022
- B.C. Future Games Trials: Top Performers - Jun 13, 2022
- B.C. Future Games Trials: Quick Hits - Jun 12, 2022
- Results From 2022 B.C. Future Games Trials - Jun 11, 2022
- Results From 2022 BC New Year Open - Feb 24, 2022
Comments
Draft Reports
Contact
Premium Content Area
To unlock contact information, you need to purchase a ScoutPLUS subscription.
Purchase Subscription OR
Login
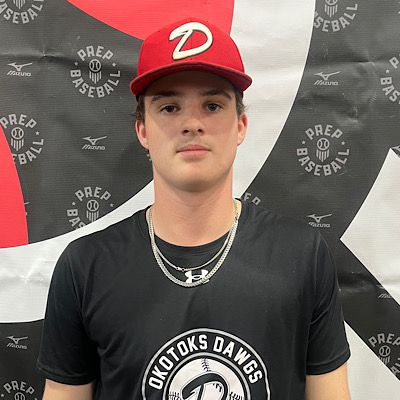
2025 C Declan Spooner (St. Johns commit) was one of the better overall 2024 positional players at the event and has developed well since we had him at the Future Games this past summer. 6-foot, 180-pounds and stood out defensively and with the bat. The left-handed swing has gotten quicker, looser and more compact since the summer while producing a top exit velocity of 94 mph and average of 90+ with wood. Quick actions behind the dish with 1.90 pop-time and velocity of 78 mph. Reclassed to a 2025 as he committed to St. Johns and now looks to be one of the top catchers in that class across the country.
Late in the Best of the West tournament, 2024 Declan Spooner got the call up to the senior team and didn't look out of place. The left-handed hitter came through in a big moment with the bases loaded and drove in a pair of runs with a base hit. With a strong senior roster in North Shore going off to school shortly, keep an eye on Spooner to be one of the next big names.