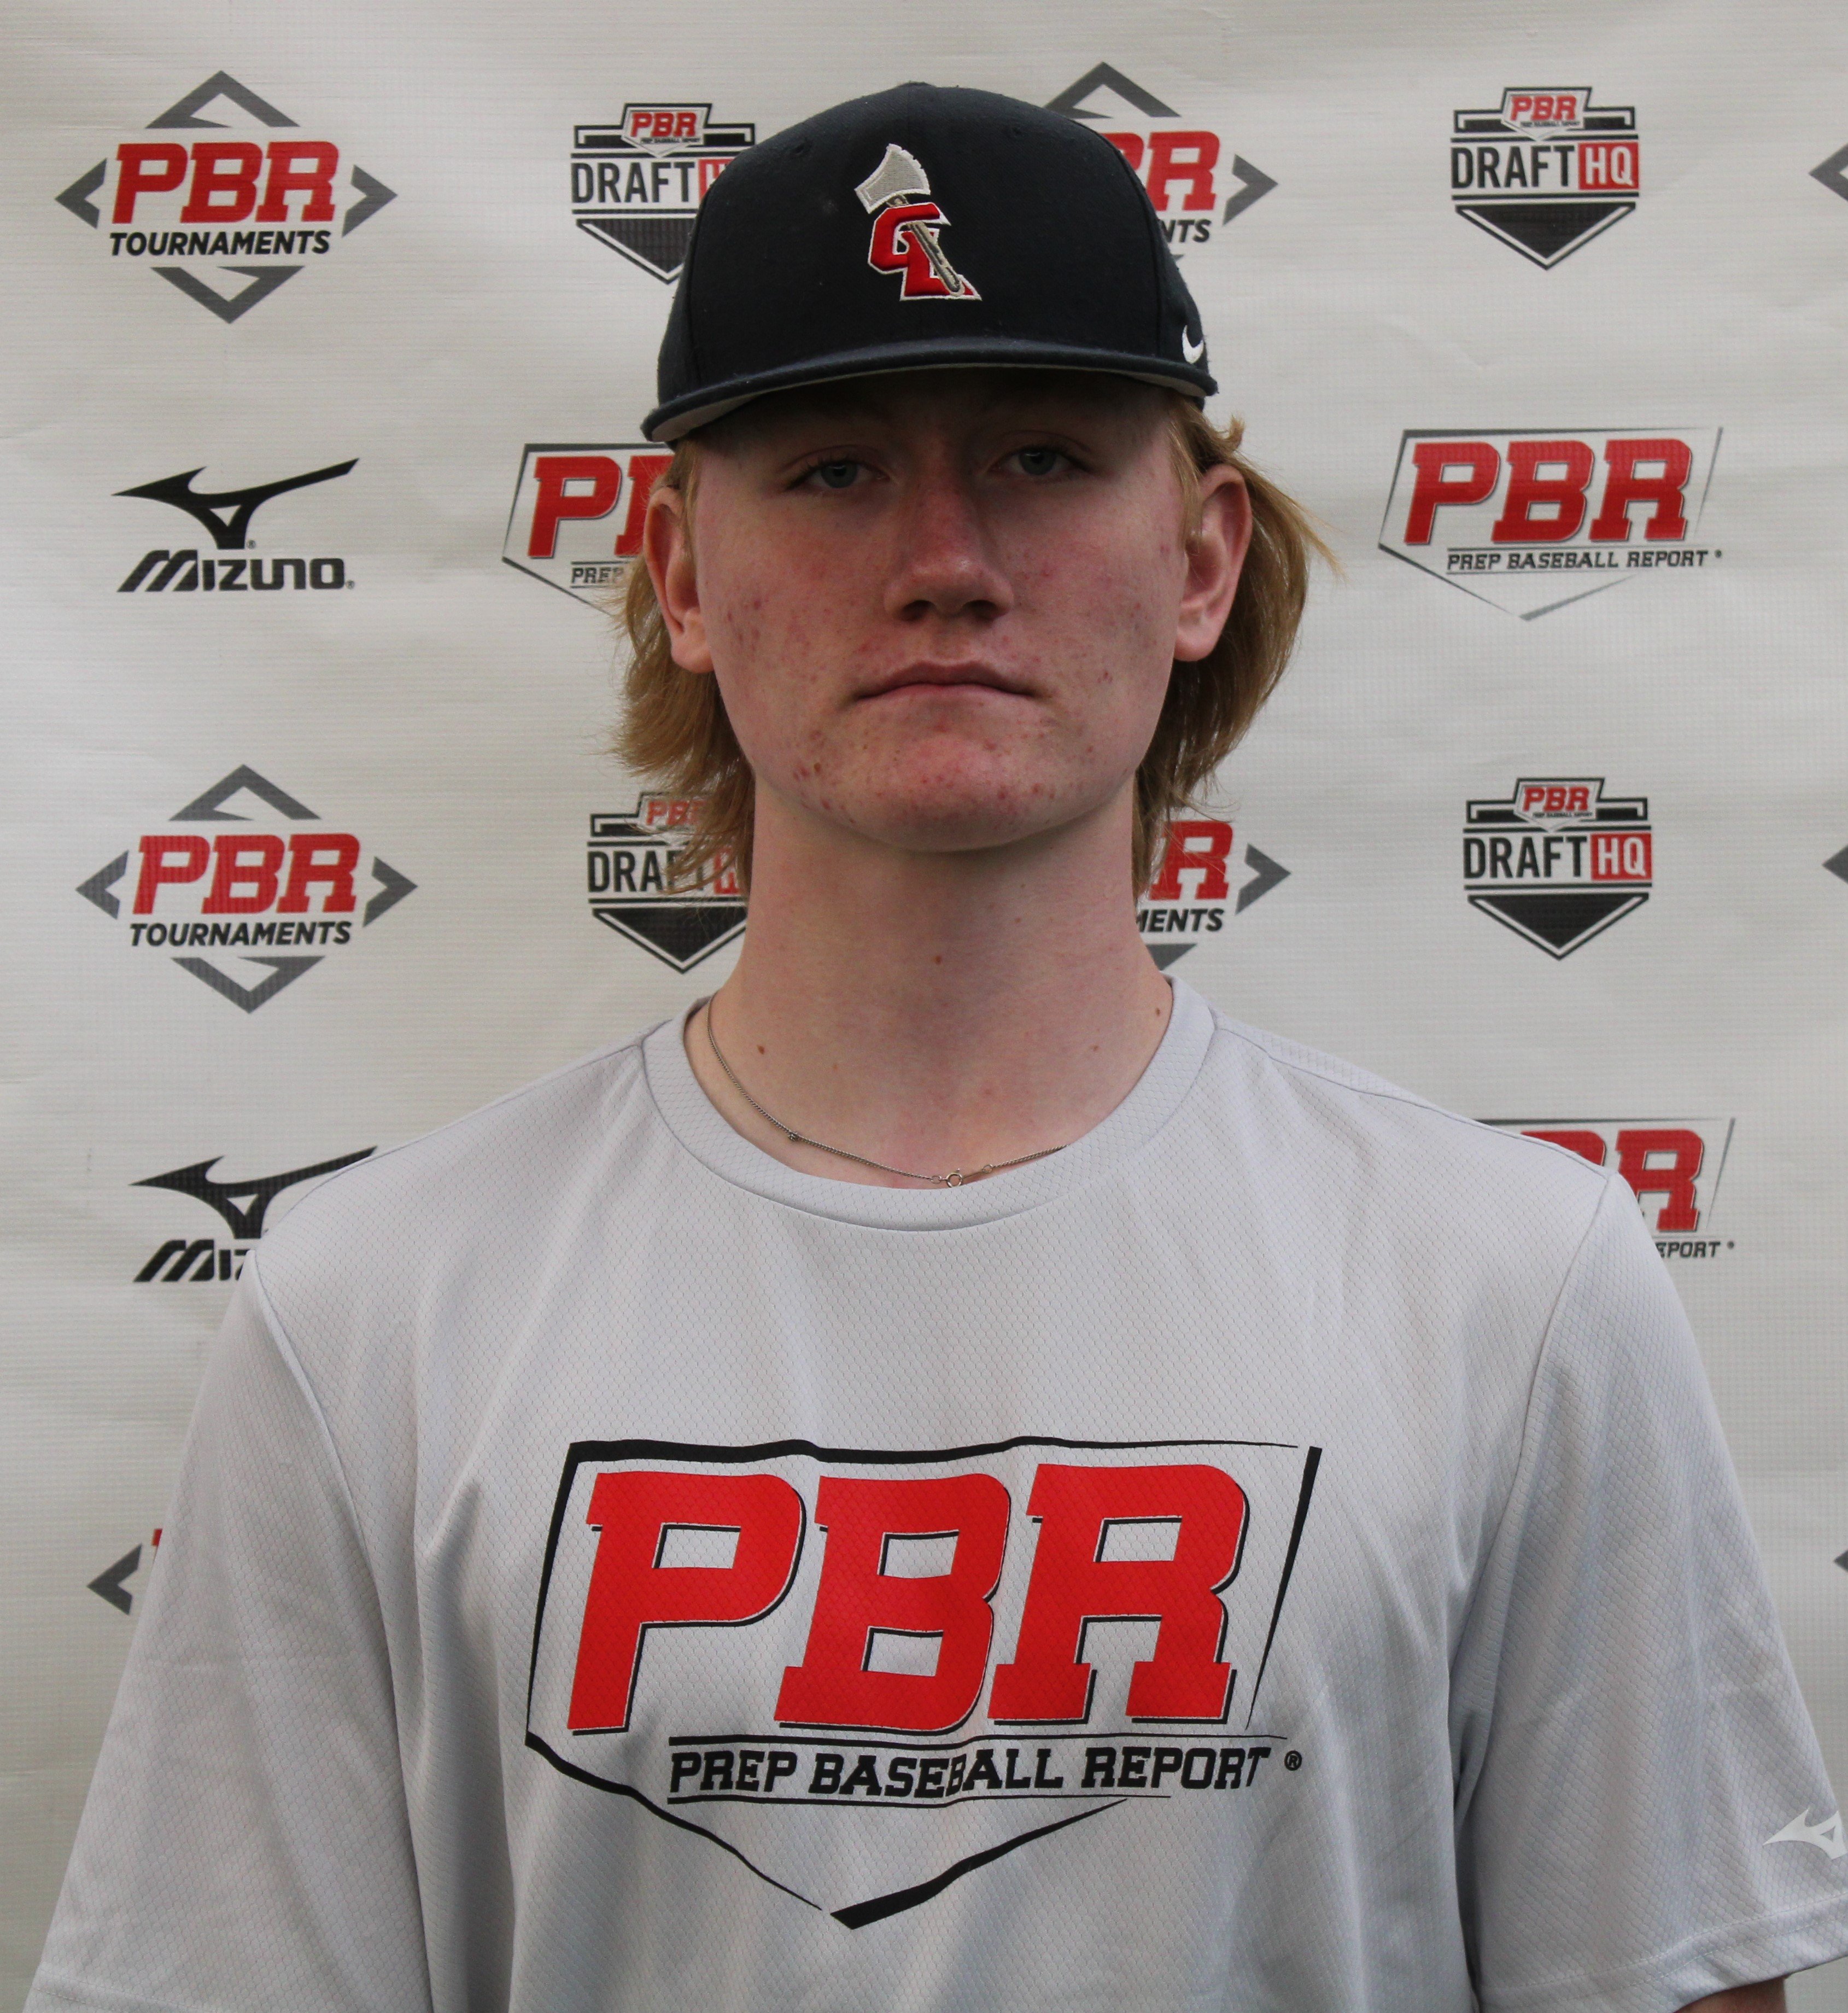
CLASS OF 2024
LHP
Anton
Sabo
Case Western Reserve
Roseville (HS) • MN
6' 4" • 200LBS
R/L • 20yr 2mo
Travel Team: Great Lakes 17u National Red
Roseville (HS) • MN
6' 4" • 200LBS
R/L • 20yr 2mo
Travel Team: Great Lakes 17u National Red
Rankings
2024 National
Rankings available to Premium Subscriber
2024 State
Rankings available to Premium Subscriber
Commitment
Best Of Stats
Fastball
83.4
Velocity (max)
3/19/23
81 - 83
Velo Range
3/19/23
1817
Spin Rate (avg)
3/19/23
Changeup
73.2 - 75.5
Velo Range
3/19/23
666
Spin Rate (avg)
3/19/23
Curveball
68.6 - 71.3
Velo Range
3/19/23
2230
Spin Rate (avg)
3/19/23
Slider
70.8 - 71.9
Velo Range
3/19/23
2210
Spin Rate (avg)
3/19/23
Positional Tools
Hitting

Hitting

Pitching

2023
Fastball
Velocity Max
The maximum observed fastball velocity in the given event year. Measured in miles per hour (MPH).
83.4
Fastball
Velocity Avg
The average velocity for all pitches of this type in the given event year. Measured in miles per hour (MPH).
82.0
Fastball
Spin Rate Avg
The average rate of spin for all pitches of this type in the given event year. Measured in rotations per minute (RPM).
1817
Fastball
Spin Score Avg
The average Bauer Units value of all fastballs in the given event year. Bauer Units are calculated for each pitch by dividing Spin Rate by Velocity.
22.1
Fastball
Total Movement Avg
The average total non-gravity movement for all pitches of this type in the given event year. Measured in inches (in).
Curveball
Velocity Avg
The average velocity for all pitches of this type in the given event year. Measured in miles per hour (MPH).
70.1
Curveball
Spin Rate Avg
The average rate of spin for all pitches of this type in the given event year. Measured in rotations per minute (RPM).
2230
Curveball
Total Movement Avg
The average total non-gravity movement for all pitches of this type in the given event year. Measured in inches (in).
Slider
Velocity Avg
The average velocity for all pitches of this type in the given event year. Measured in miles per hour (MPH).
71.4
Slider
Spin Rate Avg
The average rate of spin for all pitches of this type in the given event year. Measured in rotations per minute (RPM).
2210
Slider
Total Movement Avg
The average total non-gravity movement for all pitches of this type in the given event year. Measured in inches (in).
Splitter
Velocity Avg
The average velocity for all pitches of this type in the given event year. Measured in miles per hour (MPH).
74.4
Splitter
Spin Rate Avg
The average rate of spin for all pitches of this type in the given event year. Measured in rotations per minute (RPM).
666
Splitter
Total Movement Avg
The average total non-gravity movement for all pitches of this type in the given event year. Measured in inches (in).
PBR MN Preseason All-State (2024 Grads)
Mar 19, 2023
Trackman - Fastball
83.4
Velocity (max)
81.1 - 82.9
Velo Range
81.6
Eff Velocity (avg)
1,872
Spin Rate (max)
1,817
Spin Rate (avg)
IVB (max)
IVB (avg)
HM (max)
HM (avg)
Extension (avg)
Release Ht (avg)
Spin Score (max)
Zone %
Spin Efficiency % (avg)
Trackman - Curveball
71.3
Velocity (max)
68.6 - 71.3
Velo Range
68.0
Eff Velocity (avg)
2,277
Spin Rate (max)
2,230
Spin Rate (avg)
IVB (max)
IVB (avg)
HM (max)
HM (avg)
Extension (avg)
Release Ht (avg)
Spin Score (max)
Spin Efficiency % (avg)
Trackman - Slider
71.9
Velocity (max)
70.8 - 71.9
Velo Range
69.4
Eff Velocity (avg)
2,242
Spin Rate (max)
2,210
Spin Rate (avg)
IVB (max)
IVB (avg)
HM (max)
HM (avg)
Extension (avg)
Release Ht (avg)
Spin Score (max)
Spin Efficiency % (avg)
Trackman - Splitter
75.5
Velocity (max)
73.2 - 75.5
Velo Range
73.3
Eff Velocity (avg)
644
Spin Rate (max)
666
Spin Rate (avg)
IVB (max)
IVB (avg)
HM (max)
HM (avg)
Extension (avg)
Release Ht (avg)
Spin Score (max)
Zone %
Spin Efficiency % (avg)
Pitch Scores
2023
Fastball
Hop+
A fastball with hop has a flat approach angle and visually jumps through the zone. When thrown up in the zone, it is more likely to generate a higher swing and miss average. Hop+ of 100 is MLB average.
Fastball
Sink+
A fastball with sink has low backspin and drops through the strike zone. When thrown down in the zone, it is more likely to generate a higher ground ball percentage and lower launch angle. Sink+ of 100 is MLB average.
Fastball
Rise+
A fastball with rise has a high percentage of backspin. When thrown up in the zone, it is more likely to generate a higher fly ball percentage. Rise+ of 100 is MLB average
Pitching Velos
2023
2022
Fastball
Velocity Max
The maximum observed fastball velocity in the given event year. Measured in miles per hour (MPH).
83.0
Fastball
Velocity Avg
The average velocity for all pitches of this type in the given event year. Measured in miles per hour (MPH)
82.0
Curveball
Velocity Avg
The average velocity for all pitches of this type in the given event year. Measured in miles per hour (MPH)
70.0
Fastball
Velocity Max
The maximum observed fastball velocity in the given event year. Measured in miles per hour (MPH).
80.0
Fastball
Velocity Avg
The average velocity for all pitches of this type in the given event year. Measured in miles per hour (MPH)
78.5
Curveball
Velocity Avg
The average velocity for all pitches of this type in the given event year. Measured in miles per hour (MPH)
68.0
Changeup
Velocity Avg
The average velocity for all pitches of this type in the given event year. Measured in miles per hour (MPH)
73.5
Game Performance


Vizual Edge

Pitch Ai

Notes
News
Comments
Draft Reports
Contact
Premium Content Area
To unlock contact information, you need to purchase a ScoutPLUS subscription.
Purchase Subscription OR
Login


 Sign in to view rankings
Positional Profile: LHP
Body: 6-3, 195-pounds.
Delivery: Starts squared and balanced. Repeats, turns to tall balance position, works inline down the mound.
Arm Action: LH. Short arm action, down hill shoulders, horizontal elbow, high 3/4 slot
FB: T83, 81-83 mph. Arm side run T1872, 1817 average rpm.
CB: 69-71 mph. 1/7 break T2277, 2230 average rpm.
SL: 71-72 mph. Similar pitch T2242, 2210 average rpm.
SPLT: 73-75 mph. Down action, slight fade