CLASS OF 2023
1B
RHP
Daniel
Bello
Valley Central (HS) • NY
6' 4" • 215LBS
R/R • 20yr 11mo
Travel Team: Northeast Pride-Underclass Scout
Rankings
2023 National
Rankings available to Premium Subscriber
2023 State
Rankings available to Premium Subscriber
Commitment
Best Of Stats
25.6
Hand Speed (max)
3/06/22
82.6
Bat Speed (max)
6/08/22
18
Rot. Acc (max)
6/08/22
27
Hard Hit %
6/28/21
96
Exit Velocity (max)
3/06/22
84.7
Exit Velocity (avg)
6/28/21
367
Distance (max)
6/08/22
55
Sweet Spot %
9/19/20
7.32
60-yd
3/06/22
-
30-yd
-
10-yd
16.5
Run speed (max)
6/08/22
87
INF Velo
6/08/22
-
OF Velo
-
C Velo
-
Pop Time
Fastball
85.7
Velocity (max)
6/08/22
83.8 - 85.6
Velo Range
6/08/22
1815
Spin Rate (avg)
6/08/22
Changeup
80.4 - 81
Velo Range
6/08/22
1782
Spin Rate (avg)
6/08/22
Curveball
68.1 - 68.2
Velo Range
6/08/22
2247
Spin Rate (avg)
6/08/22
Slider
64.5 - 66.2
Velo Range
6/28/21
2076
Spin Rate (avg)
6/28/21
Positional Tools
2022
2021
2020
60 Yard Dash
The athlete's fastest 60-yard dash time in the given event year. Measured in seconds (s)
7.32
Infield Velocity
The athlete's maximum throwing velocity from an infield position in the given event year. Measured in miles per hour (MPH).
87.0
Power / Speed Score
A simple calculation that divides the athlete’s Exit Velocity Max by the athlete’s 60 Yard Dash time for the given event year. For example, 98 MPH / 7.00s = 14.00.
13.1
60 Yard Dash
The athlete's fastest 60-yard dash time in the given event year. Measured in seconds (s)
7.51
Infield Velocity
The athlete's maximum throwing velocity from an infield position in the given event year. Measured in miles per hour (MPH).
78.0
Power / Speed Score
A simple calculation that divides the athlete’s Exit Velocity Max by the athlete’s 60 Yard Dash time for the given event year. For example, 98 MPH / 7.00s = 14.00.
12.1
60 Yard Dash
The athlete's fastest 60-yard dash time in the given event year. Measured in seconds (s)
7.66
Home to First
The athlete's fastest home-to-first time in the given event year. Measured from bat-on-ball to foot-on-bag, in seconds (s).
4.72
Infield Velocity
The athlete's maximum throwing velocity from an infield position in the given event year. Measured in miles per hour (MPH).
80.0
Power / Speed Score
A simple calculation that divides the athlete’s Exit Velocity Max by the athlete’s 60 Yard Dash time for the given event year. For example, 98 MPH / 7.00s = 14.00.
11.4
Hitting
2022
2021
2020
Exit Velocity Max
The highest exit velocity of any batted ball in the given event year. Measured in miles per hour (MPH).
96.0
Exit Velocity Avg
Average exit velocity of all batted balls in the given event year. Measured in miles per hour (MPH).
80.9
Distance Max
The highest flight distance of any batted ball in the given event year. Measured in feet (ft).
367
Distance Avg
Average flight distance of all batted balls in the given event year. Measured in feet (ft).
210
Launch Angle Avg
Average launch angle of all batted balls in the given event year. Measured in degrees.
32.8911
Hard Hit %
Percentage of batted balls with exit velocities over 95 MPH in the given event year.
Sweet Spot %
Percentage of batted balls in the given event year with a launch angle between 8° and 32°.
Line Drive %
Percentage of batted balls with launch angles between 10 and 25 degrees in the given event year.
Fly Ball %
Percentage of batted balls with launch angles between 25 and 50 degrees in the given event year.
Ground Ball %
Percentage of batted balls with launch angles below 10 degrees in the given event year.
Exit Velocity Max
The highest exit velocity of any batted ball in the given event year. Measured in miles per hour (MPH).
90.8
Exit Velocity Avg
Average exit velocity of all batted balls in the given event year. Measured in miles per hour (MPH).
80.5
Distance Max
The highest flight distance of any batted ball in the given event year. Measured in feet (ft).
339
Distance Avg
Average flight distance of all batted balls in the given event year. Measured in feet (ft).
127
Launch Angle Avg
Average launch angle of all batted balls in the given event year. Measured in degrees.
11.1795
Hard Hit %
Percentage of batted balls with exit velocities over 95 MPH in the given event year.
Sweet Spot %
Percentage of batted balls in the given event year with a launch angle between 8° and 32°.
Line Drive %
Percentage of batted balls with launch angles between 10 and 25 degrees in the given event year.
Fly Ball %
Percentage of batted balls with launch angles between 25 and 50 degrees in the given event year.
Ground Ball %
Percentage of batted balls with launch angles below 10 degrees in the given event year.
Exit Velocity Max
The highest exit velocity of any batted ball in the given event year. Measured in miles per hour (MPH).
87.1
Exit Velocity Avg
Average exit velocity of all batted balls in the given event year. Measured in miles per hour (MPH).
80.4
Distance Max
The highest flight distance of any batted ball in the given event year. Measured in feet (ft).
248
Distance Avg
Average flight distance of all batted balls in the given event year. Measured in feet (ft).
168
Launch Angle Avg
Average launch angle of all batted balls in the given event year. Measured in degrees.
16.3755
Hard Hit %
Percentage of batted balls with exit velocities over 95 MPH in the given event year.
Sweet Spot %
Percentage of batted balls in the given event year with a launch angle between 8° and 32°.
Line Drive %
Percentage of batted balls with launch angles between 10 and 25 degrees in the given event year.
Fly Ball %
Percentage of batted balls with launch angles between 25 and 50 degrees in the given event year.
Ground Ball %
Percentage of batted balls with launch angles below 10 degrees in the given event year.
2022 Northeast Pride Scout Day (Summer)
Jun 8, 2022
Trackman - Hitting
93.6
Exit Velocity (max)
82.3
Exit Velocity (avg)
291
Distance (avg)
367
Distance (max)
Hard Hit %
Sweet Spot %
Fly Ball %
2022 Northeast Pride Scout Day (Preseason)
Mar 6, 2022
Trackman - Hitting
96.0
Exit Velocity (max)
79.7
Exit Velocity (avg)
139
Distance (avg)
260
Distance (max)
Hard Hit %
Fly Ball %
Ground Ball %
2021 NYS Games (Session 1)
Jun 28, 2021
Trackman - Hitting
90.8
Exit Velocity (max)
84.7
Exit Velocity (avg)
127
Distance (avg)
323
Distance (max)
Hard Hit %
Sweet Spot %
Line Drive %
Fly Ball %
Ground Ball %
2021 Northeast Pride Scout Day (Summer)
Jun 10, 2021
Trackman - Hitting
90.7
Exit Velocity (max)
79.7
Exit Velocity (avg)
148
Distance (avg)
339
Distance (max)
Hard Hit %
Sweet Spot %
Line Drive %
Fly Ball %
Ground Ball %
2021 Northeast Pride Scout Day (Preseason)
Mar 7, 2021
Trackman - Hitting
88.6
Exit Velocity (max)
76.2
Exit Velocity (avg)
101
Distance (avg)
323
Distance (max)
Sweet Spot %
Line Drive %
Fly Ball %
Ground Ball %
2020 NY Fall Prospect Showcase (AM Session 1)
Sep 19, 2020
Trackman - Hitting
87.1
Exit Velocity (max)
80.4
Exit Velocity (avg)
168
Distance (avg)
248
Distance (max)
Sweet Spot %
Line Drive %
Fly Ball %
Ground Ball %
Hitting
2022
2021
2020
Hand Speed Max
The highest Peak Hand Speed of any swing in the given event year.
25.6
Hand Speed Avg
The average Peak Hand Speed for all swings in the given event year.
23.3
Bat Speed Max
The highest Bat Speed of any swing in the given event year.
82.6
Bat Speed Avg
The average Bat Speed for all swings in the given event year.
73.6
Rotational Acceleration Max
The highest Rotational Acceleration of any swing in the given event year.
Rotational Acceleration Avg
The average Rotational Acceleration for all swings in the given event year.
On-Plane Efficiency Max
The highest On-Plane Efficiency of any swing in the given event year.
On-Plane Efficiency Avg
The average On-Plane Efficiency for all swings in the given event year.
Hand Speed Max
The highest Peak Hand Speed of any swing in the given event year.
21.7
Hand Speed Avg
The average Peak Hand Speed for all swings in the given event year.
20.1
Bat Speed Max
The highest Bat Speed of any swing in the given event year.
71.8
Bat Speed Avg
The average Bat Speed for all swings in the given event year.
68.0
Rotational Acceleration Max
The highest Rotational Acceleration of any swing in the given event year.
Rotational Acceleration Avg
The average Rotational Acceleration for all swings in the given event year.
On-Plane Efficiency Max
The highest On-Plane Efficiency of any swing in the given event year.
On-Plane Efficiency Avg
The average On-Plane Efficiency for all swings in the given event year.
Hand Speed Max
The highest Peak Hand Speed of any swing in the given event year.
22.2
Hand Speed Avg
The average Peak Hand Speed for all swings in the given event year.
21.6
Bat Speed Max
The highest Bat Speed of any swing in the given event year.
74.4
Bat Speed Avg
The average Bat Speed for all swings in the given event year.
68.5
Rotational Acceleration Max
The highest Rotational Acceleration of any swing in the given event year.
Rotational Acceleration Avg
The average Rotational Acceleration for all swings in the given event year.
On-Plane Efficiency Max
The highest On-Plane Efficiency of any swing in the given event year.
On-Plane Efficiency Avg
The average On-Plane Efficiency for all swings in the given event year.
2022 Northeast Pride Scout Day (Summer)
Jun 8, 2022
Blast - Hitting
24.0
Hand Speed (max)
23.1
Hand Speed (avg)
82.6
Bat Speed (max)
75.8
Bat Speed (avg)
Rot. Acc (max)
Rot. Acc (avg)
On Plane Eff (avg)
MaxOnPlaneEfficiency
2022 Northeast Pride Scout Day (Preseason)
Mar 6, 2022
Blast - Hitting
25.6
Hand Speed (max)
23.5
Hand Speed (avg)
73.8
Bat Speed (max)
71.4
Bat Speed (avg)
Rot. Acc (max)
Rot. Acc (avg)
On Plane Eff (avg)
MaxOnPlaneEfficiency
2021 NYS Games (Session 1)
Jun 28, 2021
Blast - Hitting
21.7
Hand Speed (max)
20.1
Hand Speed (avg)
71.8
Bat Speed (max)
68.0
Bat Speed (avg)
Rot. Acc (max)
Rot. Acc (avg)
On Plane Eff (avg)
MaxOnPlaneEfficiency
2020 NY Fall Prospect Showcase (AM Session 1)
Sep 19, 2020
Blast - Hitting
22.2
Hand Speed (max)
21.6
Hand Speed (avg)
74.4
Bat Speed (max)
68.5
Bat Speed (avg)
Rot. Acc (max)
Rot. Acc (avg)
On Plane Eff (avg)
MaxOnPlaneEfficiency
Pitching
2022
2021
Fastball
Velocity Max
The maximum observed fastball velocity in the given event year. Measured in miles per hour (MPH).
85.7
Fastball
Velocity Avg
The average velocity for all pitches of this type in the given event year. Measured in miles per hour (MPH).
83.9
Fastball
Spin Rate Avg
The average rate of spin for all pitches of this type in the given event year. Measured in rotations per minute (RPM).
1774
Fastball
Spin Score Avg
The average Bauer Units value of all fastballs in the given event year. Bauer Units are calculated for each pitch by dividing Spin Rate by Velocity.
21.2
Fastball
Total Movement Avg
The average total non-gravity movement for all pitches of this type in the given event year. Measured in inches (in).
Curveball
Velocity Avg
The average velocity for all pitches of this type in the given event year. Measured in miles per hour (MPH).
67.5
Curveball
Spin Rate Avg
The average rate of spin for all pitches of this type in the given event year. Measured in rotations per minute (RPM).
2224
Curveball
Total Movement Avg
The average total non-gravity movement for all pitches of this type in the given event year. Measured in inches (in).
Changeup
Velocity Avg
The average velocity for all pitches of this type in the given event year. Measured in miles per hour (MPH).
78.8
Changeup
Spin Rate Avg
The average rate of spin for all pitches of this type in the given event year. Measured in rotations per minute (RPM).
1600
Changeup
Total Movement Avg
The average total non-gravity movement for all pitches of this type in the given event year. Measured in inches (in).
Fastball
Velocity Max
The maximum observed fastball velocity in the given event year. Measured in miles per hour (MPH).
82.5
Fastball
Velocity Avg
The average velocity for all pitches of this type in the given event year. Measured in miles per hour (MPH).
78.1
Fastball
Spin Rate Avg
The average rate of spin for all pitches of this type in the given event year. Measured in rotations per minute (RPM).
1696
Fastball
Spin Score Avg
The average Bauer Units value of all fastballs in the given event year. Bauer Units are calculated for each pitch by dividing Spin Rate by Velocity.
21.7
Fastball
Total Movement Avg
The average total non-gravity movement for all pitches of this type in the given event year. Measured in inches (in).
Curveball
Velocity Avg
The average velocity for all pitches of this type in the given event year. Measured in miles per hour (MPH).
67.1
Curveball
Spin Rate Avg
The average rate of spin for all pitches of this type in the given event year. Measured in rotations per minute (RPM).
2079
Curveball
Total Movement Avg
The average total non-gravity movement for all pitches of this type in the given event year. Measured in inches (in).
Changeup
Velocity Avg
The average velocity for all pitches of this type in the given event year. Measured in miles per hour (MPH).
76.0
Changeup
Spin Rate Avg
The average rate of spin for all pitches of this type in the given event year. Measured in rotations per minute (RPM).
1403
Changeup
Total Movement Avg
The average total non-gravity movement for all pitches of this type in the given event year. Measured in inches (in).
Slider
Velocity Avg
The average velocity for all pitches of this type in the given event year. Measured in miles per hour (MPH).
65.3
Slider
Spin Rate Avg
The average rate of spin for all pitches of this type in the given event year. Measured in rotations per minute (RPM).
2076
Slider
Total Movement Avg
The average total non-gravity movement for all pitches of this type in the given event year. Measured in inches (in).
2022 Northeast Pride Scout Day (Summer)
Jun 8, 2022
Trackman - Fastball
85.7
Velocity (max)
83.8 - 85.6
Velo Range
82.4
Eff Velocity (avg)
1,892
Spin Rate (max)
1,815
Spin Rate (avg)
IVB (max)
IVB (avg)
HM (max)
HM (avg)
Extension (avg)
Release Ht (avg)
Spin Score (max)
Zone %
Trackman - Curveball
68.2
Velocity (max)
68.1 - 68.2
Velo Range
66.2
Eff Velocity (avg)
2,280
Spin Rate (max)
2,247
Spin Rate (avg)
IVB (max)
IVB (avg)
HM (max)
HM (avg)
Extension (avg)
Release Ht (avg)
Spin Score (max)
Zone %
Trackman - ChangeUp
81.0
Velocity (max)
80.4 - 81.0
Velo Range
78.7
Eff Velocity (avg)
1,886
Spin Rate (max)
1,782
Spin Rate (avg)
IVB (max)
IVB (avg)
HM (max)
HM (avg)
Extension (avg)
Release Ht (avg)
Spin Score (max)
Zone %
2022 Northeast Pride Scout Day (Preseason)
Mar 6, 2022
Trackman - Fastball
83.7
Velocity (max)
81.9 - 83.4
Velo Range
81.6
Eff Velocity (avg)
1,786
Spin Rate (max)
1,716
Spin Rate (avg)
IVB (max)
IVB (avg)
HM (max)
HM (avg)
Extension (avg)
Release Ht (avg)
Spin Score (max)
Zone %
Trackman - Curveball
67.1
Velocity (max)
66.5 - 67.1
Velo Range
65.2
Eff Velocity (avg)
2,216
Spin Rate (max)
2,200
Spin Rate (avg)
IVB (max)
IVB (avg)
HM (max)
HM (avg)
Extension (avg)
Release Ht (avg)
Spin Score (max)
Trackman - ChangeUp
76.1
Velocity (max)
75.6 - 76.1
Velo Range
76.1
Eff Velocity (avg)
1,350
Spin Rate (max)
1,327
Spin Rate (avg)
IVB (max)
IVB (avg)
HM (max)
HM (avg)
Extension (avg)
Release Ht (avg)
Spin Score (max)
2021 NYS Games (Session 1)
Jun 28, 2021
Trackman - Fastball
80.7
Velocity (max)
75.5 - 78.9
Velo Range
75.6
Eff Velocity (avg)
1,903
Spin Rate (max)
1,697
Spin Rate (avg)
IVB (max)
IVB (avg)
HM (max)
HM (avg)
Extension (avg)
Release Ht (avg)
Spin Score (max)
Zone %
Trackman - Curveball
67.9
Velocity (max)
66.9 - 67.9
Velo Range
65.3
Eff Velocity (avg)
2,174
Spin Rate (max)
2,025
Spin Rate (avg)
IVB (max)
IVB (avg)
HM (max)
HM (avg)
Extension (avg)
Release Ht (avg)
Spin Score (max)
Zone %
Trackman - Slider
66.2
Velocity (max)
64.5 - 66.2
Velo Range
63.1
Eff Velocity (avg)
2,109
Spin Rate (max)
2,076
Spin Rate (avg)
IVB (max)
IVB (avg)
HM (max)
HM (avg)
Extension (avg)
Release Ht (avg)
Spin Score (max)
Zone %
Trackman - ChangeUp
77.4
Velocity (max)
73.4 - 77.4
Velo Range
73.9
Eff Velocity (avg)
1,485
Spin Rate (max)
1,320
Spin Rate (avg)
IVB (max)
IVB (avg)
HM (max)
HM (avg)
Extension (avg)
Release Ht (avg)
Spin Score (max)
Zone %
2021 Northeast Pride Scout Day (Summer)
Jun 10, 2021
Trackman - Fastball
80.4
Velocity (max)
78.9 - 80.1
Velo Range
78.2
Eff Velocity (avg)
1,791
Spin Rate (max)
1,728
Spin Rate (avg)
IVB (max)
IVB (avg)
HM (max)
HM (avg)
Extension (avg)
Release Ht (avg)
Spin Score (max)
Trackman - ChangeUp
74.5
Velocity (max)
73.1
Eff Velocity (avg)
1,210
Spin Rate (max)
1,210
Spin Rate (avg)
IVB (max)
IVB (avg)
HM (max)
HM (avg)
Extension (avg)
Release Ht (avg)
Spin Score (max)
2021 Northeast Pride Scout Day (Preseason)
Mar 7, 2021
Trackman - Fastball
82.5
Velocity (max)
80.5 - 82.4
Velo Range
79.4
Eff Velocity (avg)
1,840
Spin Rate (max)
1,676
Spin Rate (avg)
IVB (max)
IVB (avg)
HM (max)
HM (avg)
Extension (avg)
Release Ht (avg)
Spin Score (max)
Zone %
Trackman - Curveball
66.8
Velocity (max)
66.2 - 66.8
Velo Range
64.4
Eff Velocity (avg)
2,220
Spin Rate (max)
2,188
Spin Rate (avg)
IVB (max)
IVB (avg)
HM (max)
HM (avg)
Extension (avg)
Release Ht (avg)
Spin Score (max)
Zone %
Trackman - ChangeUp
77.7
Velocity (max)
76.1 - 77.7
Velo Range
74.9
Eff Velocity (avg)
1,592
Spin Rate (max)
1,523
Spin Rate (avg)
IVB (max)
IVB (avg)
HM (max)
HM (avg)
Extension (avg)
Release Ht (avg)
Spin Score (max)
2020 NY Fall Prospect Showcase (AM Session 1)
Sep 19, 2020
Trackman - Fastball
77.0
Velocity (max)
74.0 - 77.0
Velo Range
73.6
Eff Velocity (avg)
1,816
Spin Rate (max)
1,714
Spin Rate (avg)
IVB (max)
IVB (avg)
HM (max)
HM (avg)
Extension (avg)
Release Ht (avg)
Spin Score (max)
Zone %
Trackman - Curveball
64.9
Velocity (max)
63.2 - 64.8
Velo Range
61.7
Eff Velocity (avg)
2,125
Spin Rate (max)
2,065
Spin Rate (avg)
IVB (max)
IVB (avg)
HM (max)
HM (avg)
Extension (avg)
Release Ht (avg)
Spin Score (max)
Trackman - ChangeUp
65.1
Velocity (max)
62.3 - 65.1
Velo Range
62.5
Eff Velocity (avg)
1,542
Spin Rate (max)
1,431
Spin Rate (avg)
IVB (max)
IVB (avg)
HM (max)
HM (avg)
Extension (avg)
Release Ht (avg)
Spin Score (max)
Zone %
Pitch Scores
2021
Fastball
Hop+
A fastball with hop has a flat approach angle and visually jumps through the zone. When thrown up in the zone, it is more likely to generate a higher swing and miss average. Hop+ of 100 is MLB average.
Fastball
Sink+
A fastball with sink has low backspin and drops through the strike zone. When thrown down in the zone, it is more likely to generate a higher ground ball percentage and lower launch angle. Sink+ of 100 is MLB average.
Fastball
Rise+
A fastball with rise has a high percentage of backspin. When thrown up in the zone, it is more likely to generate a higher fly ball percentage. Rise+ of 100 is MLB average
Curveball
Hammer+
A hammer breaking ball drops vertically with velocity through the zone, or 12-to-6 movement. Hammer+ of 100 is MLB average.
Curveball
Sweep+
A sweeping breaking ball moves horizontally with velocity through the zone. Sweep+ of 100 is MLB average.
Slider
Hammer+
A hammer breaking ball drops vertically with velocity through the zone, or 12-to-6 movement. Hammer+ of 100 is MLB average.
Slider
Sweep+
A sweeping breaking ball moves horizontally with velocity through the zone. Sweep+ of 100 is MLB average.
2021 NYS Games (Session 1)
Jun 28, 2021
Pitch Scores - Fastball
Hop+
Rise+
Sink+
Pitch Scores - Curveball
Hammer+
Sweep+
Pitch Scores - Slider
Hammer+
Sweep+
Pitching Velos
2023
2021
2020
Fastball
Velocity Max
The maximum observed fastball velocity in the given event year. Measured in miles per hour (MPH).
84.0
Fastball
Velocity Avg
The average velocity for all pitches of this type in the given event year. Measured in miles per hour (MPH)
83.5
Fastball
Velocity Max
The maximum observed fastball velocity in the given event year. Measured in miles per hour (MPH).
83.0
Fastball
Velocity Avg
The average velocity for all pitches of this type in the given event year. Measured in miles per hour (MPH)
80.3
Curveball
Velocity Avg
The average velocity for all pitches of this type in the given event year. Measured in miles per hour (MPH)
66.8
Changeup
Velocity Avg
The average velocity for all pitches of this type in the given event year. Measured in miles per hour (MPH)
76.0
Fastball
Velocity Max
The maximum observed fastball velocity in the given event year. Measured in miles per hour (MPH).
77.0
Fastball
Velocity Avg
The average velocity for all pitches of this type in the given event year. Measured in miles per hour (MPH)
75.2
Curveball
Velocity Avg
The average velocity for all pitches of this type in the given event year. Measured in miles per hour (MPH)
64.3
Changeup
Velocity Avg
The average velocity for all pitches of this type in the given event year. Measured in miles per hour (MPH)
66.2
Game Performance
2022
60 Yard Dash
The athlete's fastest 0-60-yard time in the given event year. Measured in seconds.
7.46
Top Speed (MPH)
The athlete's fastest split time converted to miles per hour.
Vizual Edge
2021
Edge Score
The highest Edge Score within the given year. Edge Score is a comprehensive score that takes the core-six visual skills into account, providing an assessment of an athlete’s overall visual ability.
63.92
Pitch Ai
Notes
News
Comments
Draft Reports
Contact
Premium Content Area
To unlock contact information, you need to purchase a ScoutPLUS subscription.
Purchase Subscription OR
Login

Sign in to view rankings
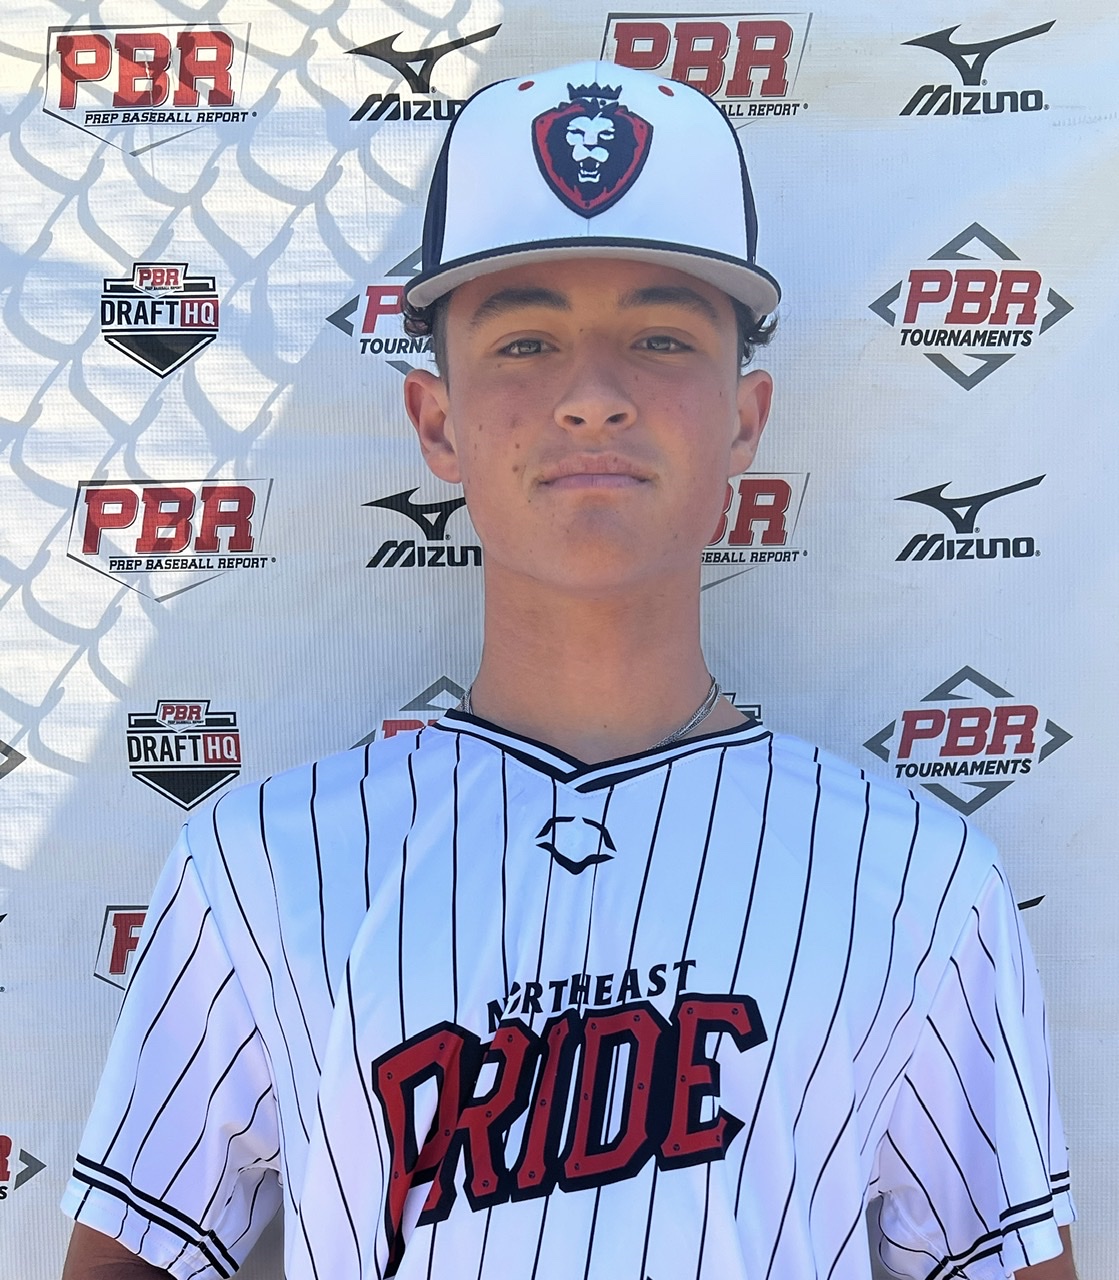
Physical: Lengthy, projectable 6-foot-3, 190lb frame with strength available. 7.68 runner in the 60-yard dash.
Offensively: RHH - Balanced, slightly closed off stance as the hands operated flat on the shoulder to start. Utilized a stretched lift and replace stride to the pitcher, initiating through a slightly uphill path into the hitting zone as his posture stayed over the backside during the move. Was able to lift the baseball to pull with consistency, working up to a 323 foot batted ball distance via Trackman during his round. Got negatively into the slot at times, creating a mostly pull-side approach, encouraging extra rotation in the swing. Notched a T91 mph bat-exit velocity pointing towards current doubles power and will continue seeing measurables increase as he keeps filling out.
Defensively: The first baseman showcased a moderately low posture on the approach, getting the ball on time with a glove hand that funneled in close to the body, playing accurately in between the legs. Adequate feel around the bag and length in space attributing to some range on routes. Released accurately from H ¾ at 78 mph with more available.
Pitching: RHP - Started off the far right side of the rubber from the stretch-only as he comes set just inside shoulder-width. Gradual leg lift to an even position at the waist before separating and driving down the slope with pace into footstrike at ¾ slot. The FB ranged from 78-81 mph with arm-side run into the strike zone at 1699rpms. Mixed a well-thrown 66-68 mph CB that landed consistently for strikes at a 67% clip (sweeper, 2174rpms), later adding a 64-66 mph SL with more consistent shape to it for strikeouts. A 75-77 mph CH was commanded with killed spin at 1320rpms with ability to be a good fourth pitch down the road.
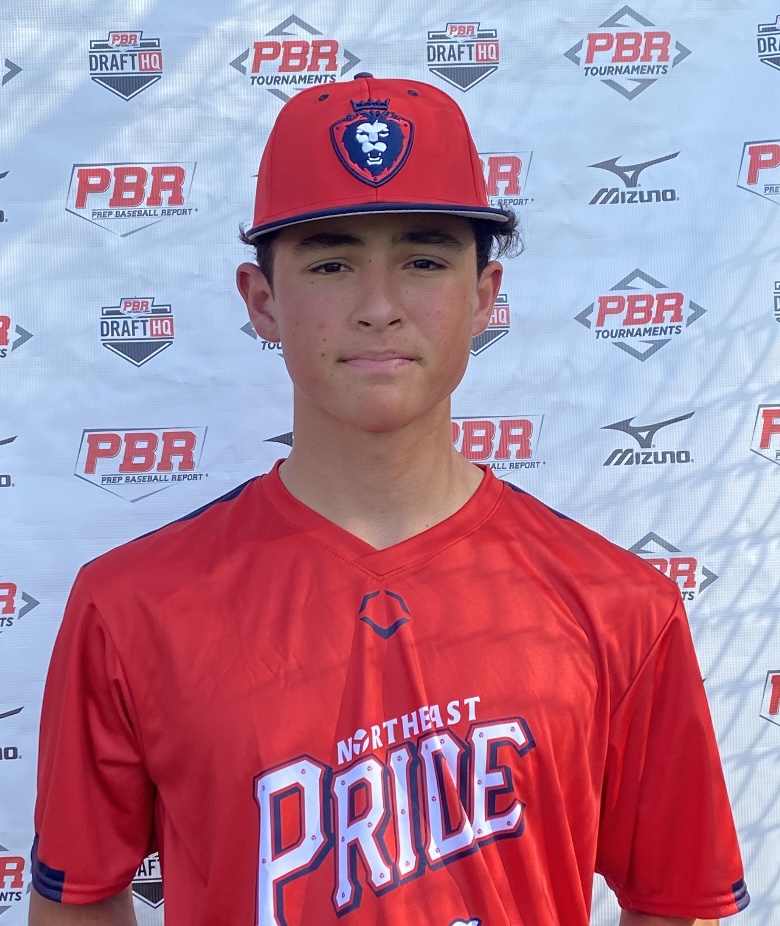
Physical: Long / lean 6-foot-2, 180-pound frame with projectability in the build. 7.80 runner in the 60-yard dash. Offensively: RHH. wide / balanced setup with the hands starting at the shoulder with a loose approach. Utilized a short and quick lift and replace stride to initiate the hands through a flat path into the hitting zone. Stayed relatively moderate throughout the swing in the posture while hitting into a stiff front side, could get handsy at times but showed good direction in the lower half, worked well through extension and allowed the long levers to play at the front of the plate. Demonstrated a middle-pull side approach during batting practice, Recorded a peak bat-exit velocity of 87 mph per Trackman Baseball. Defensively: The primary first baseman featured a medium-high center of gravity during defensive evaluations with adequate feel around the bag, soft glove hand played out in front while fielding off of the middle of his body, able to use inside turns on double play footwork, long strides and could range to his glove hand side. INF - 78 mph Pitching: RHP - Started from the left side of the rubber with average pace to the delivery, side rocker step into a medium-high leg lift, repeatability in the movements, sits through the backside before driving out towards the plate, landed tall with downward plane on the FB, got over the front side well after release through a high ¾ slot. FB ranged from 74-76 T77 mph getting an upwards of 1819 spin per Trackman Baseball, mixed in a sharp 63-65 mph breaker with feel for spin on the bump and countered with a straight 63-65 mph CH.
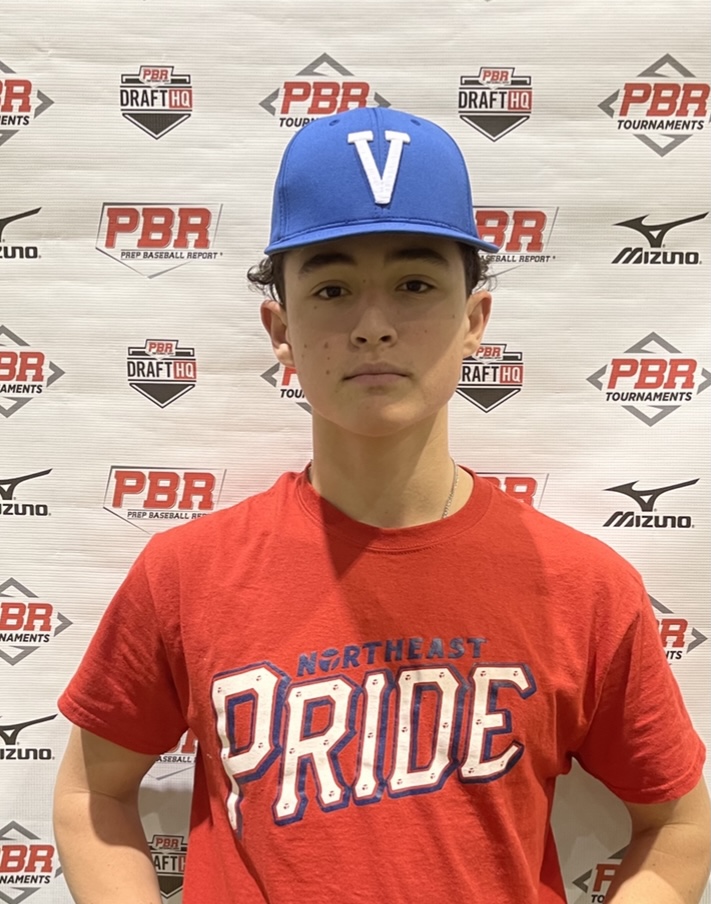
Physical: 6-foot-2, 175-pounds. Long limbs; able to hold more weight; lanky. 7.66 runner in the 60; 4.72 home-to-1B.
Offensively: RHH. Wide base, feet wider than shoulder width; toe taps for timing; short stride; no leg lift; hands stay high. Hits ball where it's pitched; sprays; level bat through zone; good quick hands. Contact all over; low line drives; shows pop to middle of the field. 80 MPH raw exit velocity.
Defensively: Good footwork around the bag turning two; choppy footwork straight up; funnels ball into body. 3/4 arm slot; medium arm swing. INF - 80 MPH.
Pitching: Works out of stretch; high leg lift before sitting into back leg as he glides out to a slightly open landing, repeatable release and balanced follow through. Long arm action going straight back out of the glove before getting up to a 3/4 slot.
FB: T77, 74-76 MPH. Commands the zone with arm side run.
CB: 65-66 MPH. Tight 12-6 break.
CH: 70-72 MPH. Fastball arm speed with some arm side sink.