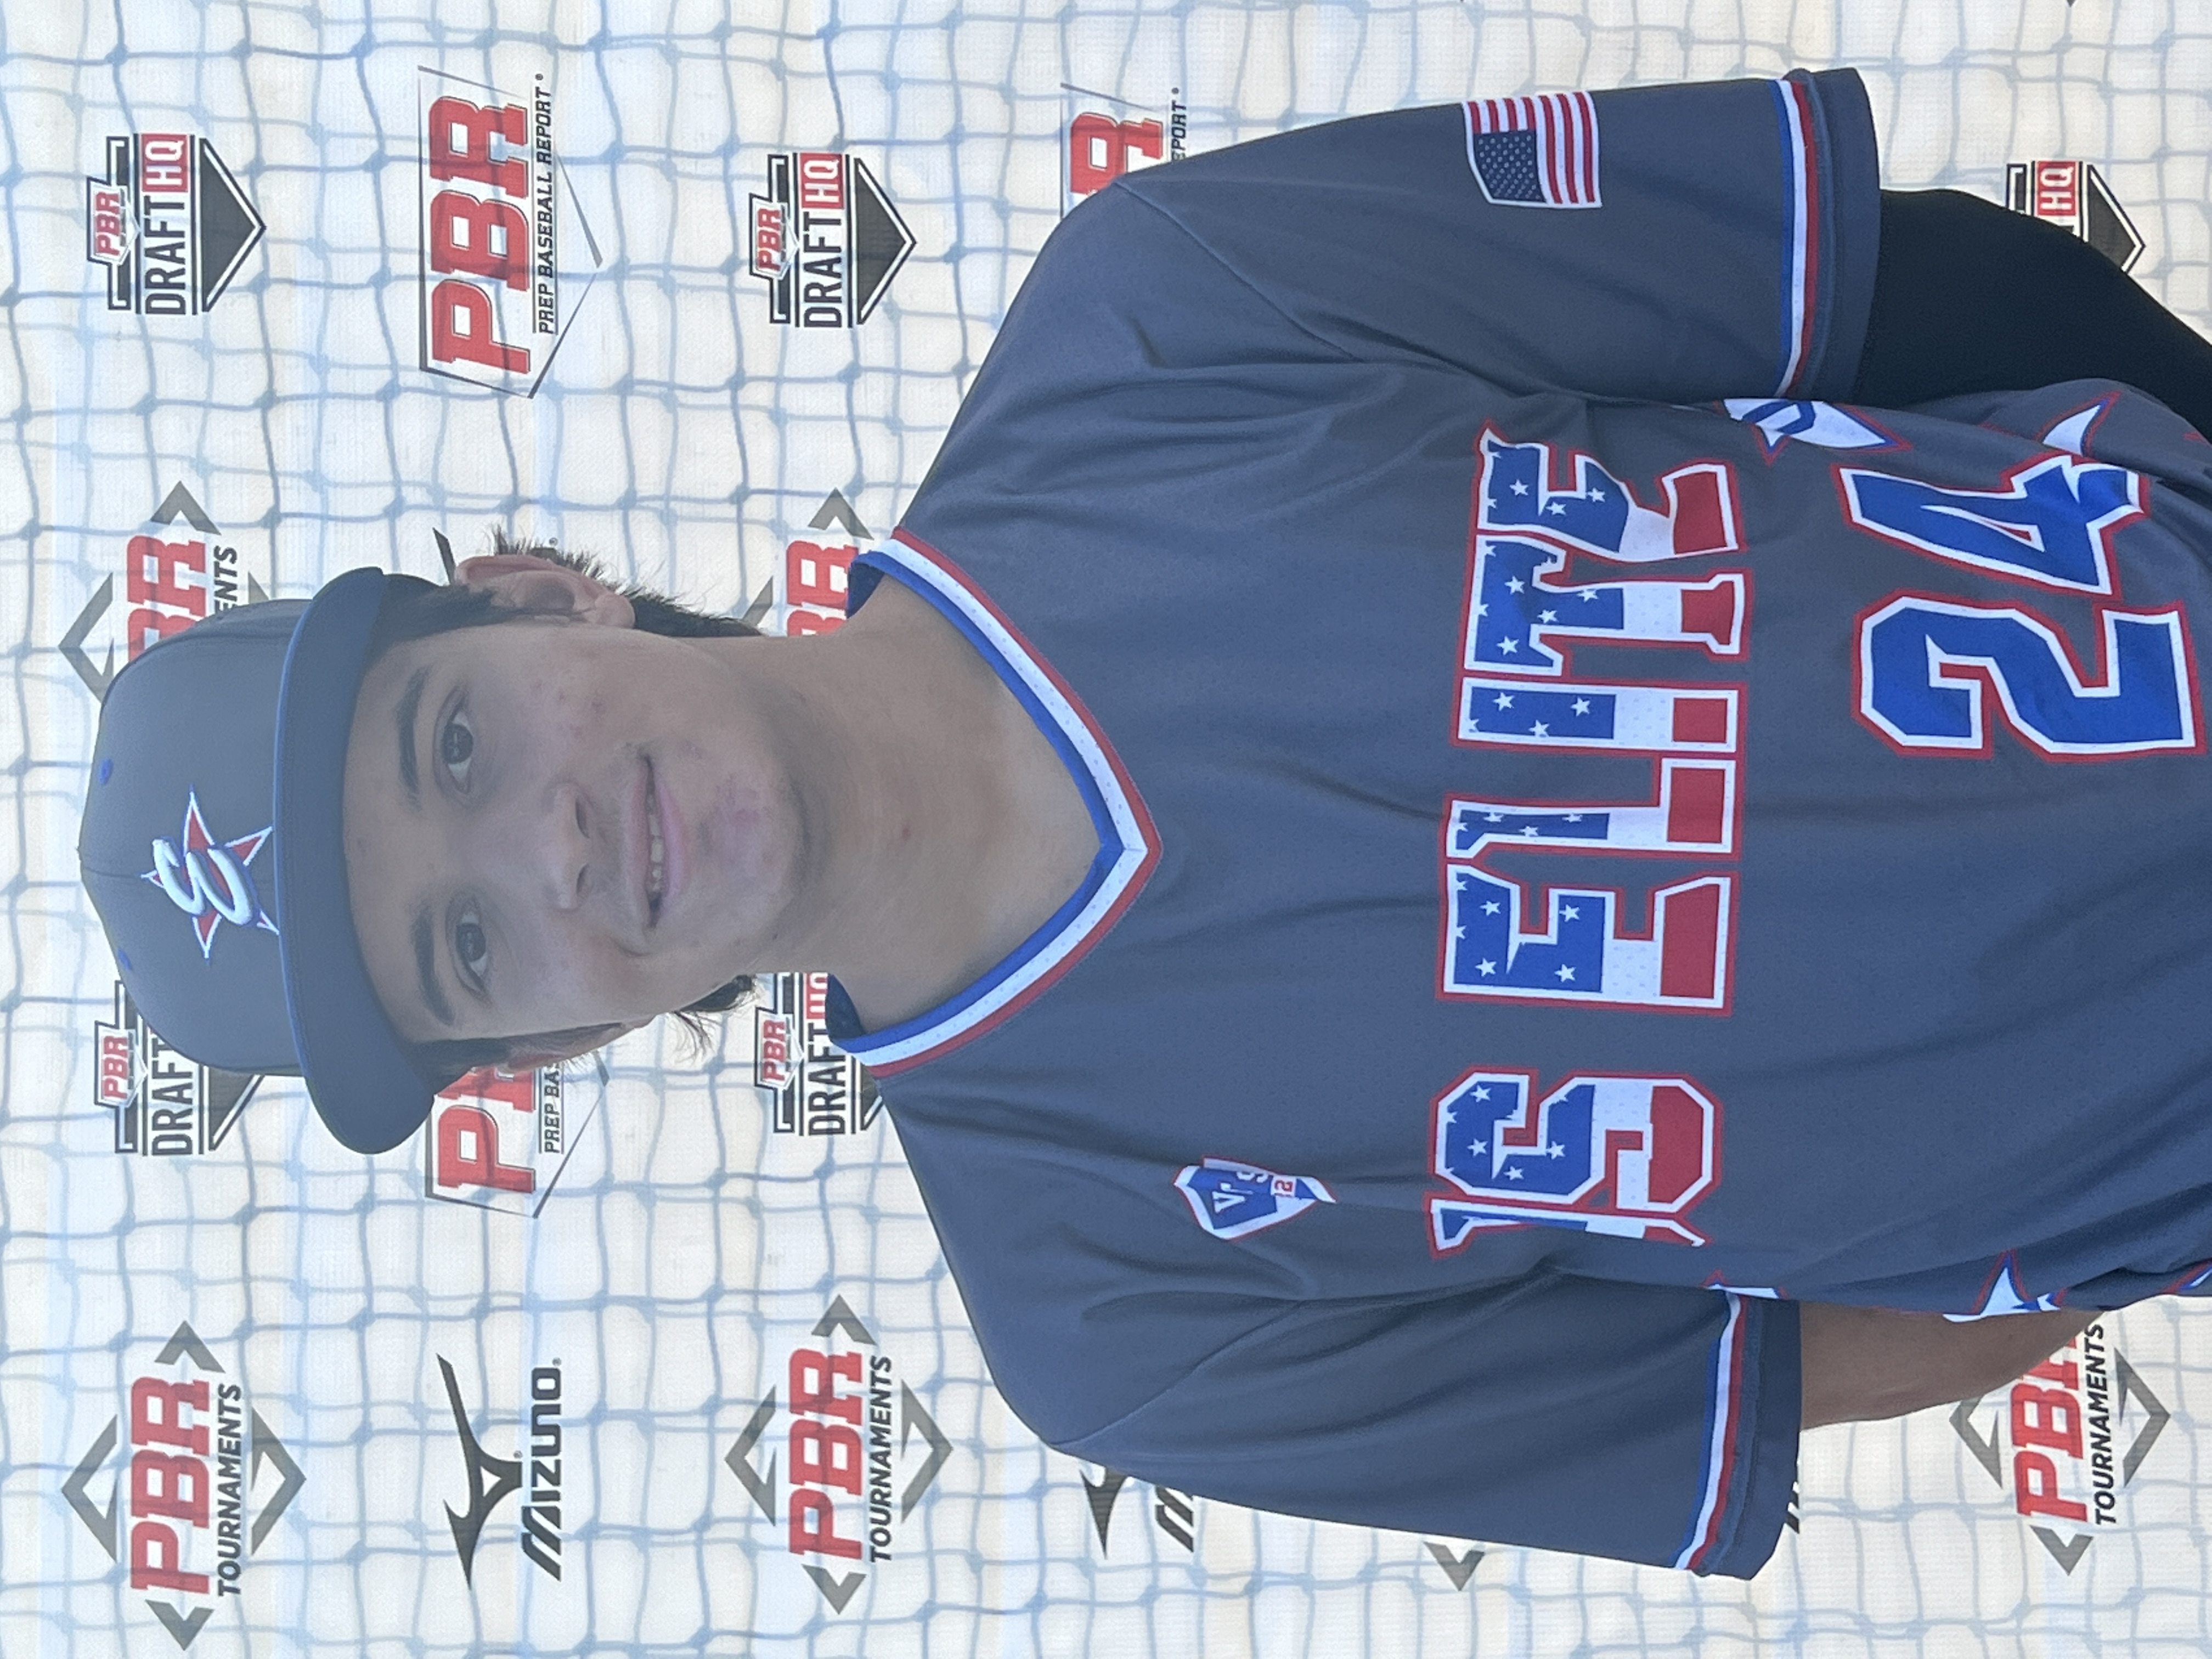
CLASS OF 2024
LHP
OF
Chase
Moyer
Wilmington (DE)
Northwestern Lehigh (HS) • PA
6' 1" • 175LBS
L/L • 19yr 10mo
Travel Team: US Elite Mid-Atlantic 2024
Northwestern Lehigh (HS) • PA
6' 1" • 175LBS
L/L • 19yr 10mo
Travel Team: US Elite Mid-Atlantic 2024
Rankings
2024 National
Rankings available to Premium Subscriber
2024 State
Rankings available to Premium Subscriber
Commitment
Best Of Stats
Fastball
83
Velocity (max)
6/23/22
81 - 83
Velo Range
6/14/23
2216
Spin Rate (avg)
2/26/23
Changeup
73.4 - 76.5
Velo Range
2/26/23
1618
Spin Rate (avg)
2/26/23
Curveball
72 - 76
Velo Range
6/23/22
2337
Spin Rate (avg)
6/13/23
Slider
70.8 - 73.7
Velo Range
6/13/23
2417
Spin Rate (avg)
6/13/23
7.75
60-yd
8/27/22
4.26
30-yd
8/27/22
1.89
10-yd
8/27/22
17.6
Run speed (max)
8/27/22
Positional Tools
2022
60 Yard Dash
The athlete's fastest 60-yard dash time in the given event year. Measured in seconds (s)
7.75
Hitting

Hitting

Pitching

2023
2022
2021
Fastball
Velocity Max
The maximum observed fastball velocity in the given event year. Measured in miles per hour (MPH).
82.0
Fastball
Velocity Avg
The average velocity for all pitches of this type in the given event year. Measured in miles per hour (MPH).
80.6
Fastball
Spin Rate Avg
The average rate of spin for all pitches of this type in the given event year. Measured in rotations per minute (RPM).
2195
Fastball
Spin Score Avg
The average Bauer Units value of all fastballs in the given event year. Bauer Units are calculated for each pitch by dividing Spin Rate by Velocity.
27.2
Fastball
Total Movement Avg
The average total non-gravity movement for all pitches of this type in the given event year. Measured in inches (in).
Curveball
Velocity Avg
The average velocity for all pitches of this type in the given event year. Measured in miles per hour (MPH).
69.5
Curveball
Spin Rate Avg
The average rate of spin for all pitches of this type in the given event year. Measured in rotations per minute (RPM).
2331
Curveball
Total Movement Avg
The average total non-gravity movement for all pitches of this type in the given event year. Measured in inches (in).
Changeup
Velocity Avg
The average velocity for all pitches of this type in the given event year. Measured in miles per hour (MPH).
75.0
Changeup
Spin Rate Avg
The average rate of spin for all pitches of this type in the given event year. Measured in rotations per minute (RPM).
1618
Changeup
Total Movement Avg
The average total non-gravity movement for all pitches of this type in the given event year. Measured in inches (in).
Slider
Velocity Avg
The average velocity for all pitches of this type in the given event year. Measured in miles per hour (MPH).
72.2
Slider
Spin Rate Avg
The average rate of spin for all pitches of this type in the given event year. Measured in rotations per minute (RPM).
2417
Slider
Total Movement Avg
The average total non-gravity movement for all pitches of this type in the given event year. Measured in inches (in).
Fastball
Velocity Max
The maximum observed fastball velocity in the given event year. Measured in miles per hour (MPH).
77.5
Fastball
Velocity Avg
The average velocity for all pitches of this type in the given event year. Measured in miles per hour (MPH).
76.2
Fastball
Spin Rate Avg
The average rate of spin for all pitches of this type in the given event year. Measured in rotations per minute (RPM).
1944
Fastball
Spin Score Avg
The average Bauer Units value of all fastballs in the given event year. Bauer Units are calculated for each pitch by dividing Spin Rate by Velocity.
25.5
Fastball
Total Movement Avg
The average total non-gravity movement for all pitches of this type in the given event year. Measured in inches (in).
Curveball
Velocity Avg
The average velocity for all pitches of this type in the given event year. Measured in miles per hour (MPH).
67.1
Curveball
Spin Rate Avg
The average rate of spin for all pitches of this type in the given event year. Measured in rotations per minute (RPM).
1943
Curveball
Total Movement Avg
The average total non-gravity movement for all pitches of this type in the given event year. Measured in inches (in).
Fastball
Velocity Max
The maximum observed fastball velocity in the given event year. Measured in miles per hour (MPH).
74.8
Fastball
Velocity Avg
The average velocity for all pitches of this type in the given event year. Measured in miles per hour (MPH).
73.1
Fastball
Spin Rate Avg
The average rate of spin for all pitches of this type in the given event year. Measured in rotations per minute (RPM).
1714
Fastball
Spin Score Avg
The average Bauer Units value of all fastballs in the given event year. Bauer Units are calculated for each pitch by dividing Spin Rate by Velocity.
23.5
Fastball
Total Movement Avg
The average total non-gravity movement for all pitches of this type in the given event year. Measured in inches (in).
Curveball
Velocity Avg
The average velocity for all pitches of this type in the given event year. Measured in miles per hour (MPH).
58.8
Curveball
Spin Rate Avg
The average rate of spin for all pitches of this type in the given event year. Measured in rotations per minute (RPM).
1842
Curveball
Total Movement Avg
The average total non-gravity movement for all pitches of this type in the given event year. Measured in inches (in).
Changeup
Velocity Avg
The average velocity for all pitches of this type in the given event year. Measured in miles per hour (MPH).
67.4
Changeup
Spin Rate Avg
The average rate of spin for all pitches of this type in the given event year. Measured in rotations per minute (RPM).
1193
Changeup
Total Movement Avg
The average total non-gravity movement for all pitches of this type in the given event year. Measured in inches (in).
2023 PA State Games (Session 1)
Jun 13, 2023
Trackman - Fastball
81.9
Velocity (max)
79.5 - 81.3
Velo Range
78.6
Eff Velocity (avg)
2,392
Spin Rate (max)
2,182
Spin Rate (avg)
IVB (max)
IVB (avg)
HM (max)
HM (avg)
Extension (avg)
Release Ht (avg)
Spin Score (max)
Zone %
Spin Efficiency % (avg)
Trackman - Curveball
69.7
Velocity (max)
67.5 - 69.3
Velo Range
65.7
Eff Velocity (avg)
2,443
Spin Rate (max)
2,337
Spin Rate (avg)
IVB (max)
IVB (avg)
HM (max)
HM (avg)
Extension (avg)
Release Ht (avg)
Spin Score (max)
Zone %
Spin Efficiency % (avg)
Trackman - Slider
73.7
Velocity (max)
70.8 - 73.7
Velo Range
71.1
Eff Velocity (avg)
2,437
Spin Rate (max)
2,417
Spin Rate (avg)
IVB (max)
IVB (avg)
HM (max)
HM (avg)
Extension (avg)
Release Ht (avg)
Spin Score (max)
Zone %
Spin Efficiency % (avg)
2023 Preseason ID: East
Feb 26, 2023
Trackman - Fastball
82.0
Velocity (max)
80.2 - 81.5
Velo Range
76.9
Eff Velocity (avg)
2,353
Spin Rate (max)
2,216
Spin Rate (avg)
IVB (max)
IVB (avg)
HM (max)
HM (avg)
Extension (avg)
Release Ht (avg)
Spin Score (max)
Zone %
Spin Efficiency % (avg)
Trackman - Curveball
72.8
Velocity (max)
70.5 - 72.5
Velo Range
67.0
Eff Velocity (avg)
2,355
Spin Rate (max)
2,321
Spin Rate (avg)
IVB (max)
IVB (avg)
HM (max)
HM (avg)
Extension (avg)
Release Ht (avg)
Spin Score (max)
Zone %
Spin Efficiency % (avg)
Trackman - ChangeUp
76.5
Velocity (max)
73.4 - 76.5
Velo Range
71.1
Eff Velocity (avg)
1,841
Spin Rate (max)
1,618
Spin Rate (avg)
IVB (max)
IVB (avg)
HM (max)
HM (avg)
Extension (avg)
Release Ht (avg)
Spin Score (max)
Zone %
Spin Efficiency % (avg)
Scout Day: US Elite Mid-Atlantic
Aug 27, 2022
Trackman - Fastball
77.5
Velocity (max)
75.3 - 77.1
Velo Range
74.9
Eff Velocity (avg)
2,022
Spin Rate (max)
1,944
Spin Rate (avg)
IVB (max)
IVB (avg)
HM (max)
HM (avg)
Extension (avg)
Release Ht (avg)
Spin Score (max)
Zone %
Trackman - Curveball
68.5
Velocity (max)
66.3 - 67.9
Velo Range
65.2
Eff Velocity (avg)
2,028
Spin Rate (max)
1,943
Spin Rate (avg)
IVB (max)
IVB (avg)
HM (max)
HM (avg)
Extension (avg)
Release Ht (avg)
Spin Score (max)
Zone %
2021 Preseason All-State - North/Central
Feb 14, 2021
Trackman - Fastball
74.8
Velocity (max)
72.1 - 74.0
Velo Range
70.4
Eff Velocity (avg)
1,795
Spin Rate (max)
1,714
Spin Rate (avg)
IVB (max)
IVB (avg)
HM (max)
HM (avg)
Extension (avg)
Release Ht (avg)
Spin Score (max)
Zone %
Trackman - Curveball
59.7
Velocity (max)
57.9 - 59.7
Velo Range
55.3
Eff Velocity (avg)
1,889
Spin Rate (max)
1,842
Spin Rate (avg)
IVB (max)
IVB (avg)
HM (max)
HM (avg)
Extension (avg)
Release Ht (avg)
Spin Score (max)
Zone %
Trackman - ChangeUp
69.2
Velocity (max)
66.0 - 68.8
Velo Range
65.0
Eff Velocity (avg)
1,467
Spin Rate (max)
1,193
Spin Rate (avg)
IVB (max)
IVB (avg)
HM (max)
HM (avg)
Extension (avg)
Release Ht (avg)
Spin Score (max)
Zone %
Pitch Scores
Pitching Velos
2023
2022
2021
Fastball
Velocity Max
The maximum observed fastball velocity in the given event year. Measured in miles per hour (MPH).
83.0
Fastball
Velocity Avg
The average velocity for all pitches of this type in the given event year. Measured in miles per hour (MPH)
82.0
Curveball
Velocity Avg
The average velocity for all pitches of this type in the given event year. Measured in miles per hour (MPH)
74.0
Changeup
Velocity Avg
The average velocity for all pitches of this type in the given event year. Measured in miles per hour (MPH)
75.5
Slider
Velocity Avg
The average velocity for all pitches of this type in the given event year. Measured in miles per hour (MPH)
70.0
Fastball
Velocity Max
The maximum observed fastball velocity in the given event year. Measured in miles per hour (MPH).
78.0
Fastball
Velocity Avg
The average velocity for all pitches of this type in the given event year. Measured in miles per hour (MPH)
76.5
Curveball
Velocity Avg
The average velocity for all pitches of this type in the given event year. Measured in miles per hour (MPH)
67.0
Fastball
Velocity Max
The maximum observed fastball velocity in the given event year. Measured in miles per hour (MPH).
75.0
Fastball
Velocity Avg
The average velocity for all pitches of this type in the given event year. Measured in miles per hour (MPH)
73.5
Curveball
Velocity Avg
The average velocity for all pitches of this type in the given event year. Measured in miles per hour (MPH)
58.5
Changeup
Velocity Avg
The average velocity for all pitches of this type in the given event year. Measured in miles per hour (MPH)
67.5
Game Performance

2022
10 Yard Dash
The athlete's fastest 0-10-yard split time in the given event year. Measured in seconds.
1.89
30 Yard Dash
The athlete's fastest 0-30-yard split time in the given event year. Measured in seconds.
4.26
60 Yard Dash
The athlete's fastest 0-60-yard time in the given event year. Measured in seconds.
7.75
Top Speed (MPH)
The athlete's fastest split time converted to miles per hour.

Vizual Edge

Pitch Ai

Notes
News
Comments
Draft Reports
Contact
Premium Content Area
To unlock contact information, you need to purchase a ScoutPLUS subscription.
Purchase Subscription OR
Login


 Sign in to view rankings
Physical: 6-1, 175 pounds; Slender, long build.
Pitching: Uses an arm side setup working primarily from the stretch. Belt high leg drive with a slight lean over the belt. Has a long stride while landing slightly closed. Long arm swing while showing some scap load; standard 3/4 slot. Upright with finish. FB: Peak velo of 82 MPH, while sitting 79-82 MPH; arm side run. CB: 67-69 MPH; 10-4 shape. SL: 71-74 MPH; lateral action. Has some room to grow into his frame, potentially could be a dominant backend arm.
Physical: 6’ 150lb LHP has a thin frame with time to add strength over time.
Pitching: Pitches mainly out of the stretch. He has a simple leg lift where he begins his momentum towards home plate. As he separates his hands and begins to drive off of his back side, he stabs the ball down towards the rubber. The arm continues its swing, working OTT as he pulls his front shoulder down through the pitch.