CLASS OF 2024
RHP
OF
Andrew
Johnson
USC
Capistrano Valley Christian (HS) • CA
6' 4" • 220LBS
R/R • 19yr 11mo
Travel Team: GBG National 2024
Capistrano Valley Christian (HS) • CA
6' 4" • 220LBS
R/R • 19yr 11mo
Travel Team: GBG National 2024
Rankings
2024 National
Rankings available to Premium Subscriber
2024 State
Rankings available to Premium Subscriber
Commitment
Best Of Stats
Fastball
90
Velocity (max)
6/04/23
85 - 89
Velo Range
6/04/23
2384
Spin Rate (avg)
7/27/22
Changeup
81.1 - 81.9
Velo Range
1/08/23
1870
Spin Rate (avg)
7/27/22
Curveball
72.3 - 76.3
Velo Range
6/04/23
2381
Spin Rate (avg)
7/27/22
Slider
69.9 - 72.2
Velo Range
1/08/23
2270
Spin Rate (avg)
1/08/23
79.8
Exit Velocity (max)
7/28/21
68.2
Exit Velocity (avg)
7/28/21
256
Distance (max)
7/28/21
78
Sweet Spot %
10/10/20
21.2
Hand Speed (max)
10/10/20
66.2
Bat Speed (max)
10/10/20
7.4
Rot. Acc (max)
7/28/21
-
Hard Hit %
7.31
60-yd
7/28/21
-
30-yd
-
10-yd
-
Run speed (max)
-
INF Velo
82
OF Velo
7/28/21
-
C Velo
-
Pop Time
Positional Tools
2021
2020
60 Yard Dash
The athlete's fastest 60-yard dash time in the given event year. Measured in seconds (s)
7.31
Outfield Velocity
The athlete's maximum throwing velocity from an outfield position in the given event year. Measured in miles per hour (MPH).
82.0
60 Yard Dash
The athlete's fastest 60-yard dash time in the given event year. Measured in seconds (s)
7.31
Outfield Velocity
The athlete's maximum throwing velocity from an outfield position in the given event year. Measured in miles per hour (MPH).
82.0
Power / Speed Score
A simple calculation that divides the athlete’s Exit Velocity Max by the athlete’s 60 Yard Dash time for the given event year. For example, 98 MPH / 7.00s = 14.00.
10.8
Hitting
2020
Exit Velocity Max
The highest exit velocity of any batted ball in the given event year. Measured in miles per hour (MPH).
79.3
Exit Velocity Avg
Average exit velocity of all batted balls in the given event year. Measured in miles per hour (MPH).
67.2
Distance Max
The highest flight distance of any batted ball in the given event year. Measured in feet (ft).
244
Distance Avg
Average flight distance of all batted balls in the given event year. Measured in feet (ft).
162
Launch Angle Avg
Average launch angle of all batted balls in the given event year. Measured in degrees.
18.5
Hard Hit %
Percentage of batted balls with exit velocities over 95 MPH in the given event year.
Sweet Spot %
Percentage of batted balls in the given event year with a launch angle between 8° and 32°.
Line Drive %
Percentage of batted balls with launch angles between 10 and 25 degrees in the given event year.
Fly Ball %
Percentage of batted balls with launch angles between 25 and 50 degrees in the given event year.
Ground Ball %
Percentage of batted balls with launch angles below 10 degrees in the given event year.
2021 Future Games
Jul 28, 2021
Trackman - Hitting
79.8
Exit Velocity (max)
68.2
Exit Velocity (avg)
101
Distance (avg)
256
Distance (max)
Sweet Spot %
Line Drive %
Fly Ball %
Ground Ball %
AZ/CA/MV/PNW Workout Pod
Jul 28, 2021
Trackman - Hitting
79.8
Exit Velocity (max)
68.2
Exit Velocity (avg)
101
Distance (avg)
256
Distance (max)
Sweet Spot %
Line Drive %
Fly Ball %
Ground Ball %
SoCal Underclass I.D. Camp
Oct 10, 2020
Trackman - Hitting
79.3
Exit Velocity (max)
67.2
Exit Velocity (avg)
162
Distance (avg)
244
Distance (max)
Sweet Spot %
Line Drive %
Fly Ball %
Ground Ball %
Hitting
2021
2020
Hand Speed Max
The highest Peak Hand Speed of any swing in the given event year.
20.3
Hand Speed Avg
The average Peak Hand Speed for all swings in the given event year.
18.7
Bat Speed Max
The highest Bat Speed of any swing in the given event year.
63.9
Bat Speed Avg
The average Bat Speed for all swings in the given event year.
59.2
Rotational Acceleration Max
The highest Rotational Acceleration of any swing in the given event year.
Rotational Acceleration Avg
The average Rotational Acceleration for all swings in the given event year.
On-Plane Efficiency Max
The highest On-Plane Efficiency of any swing in the given event year.
On-Plane Efficiency Avg
The average On-Plane Efficiency for all swings in the given event year.
Hand Speed Max
The highest Peak Hand Speed of any swing in the given event year.
21.2
Hand Speed Avg
The average Peak Hand Speed for all swings in the given event year.
19.3
Bat Speed Max
The highest Bat Speed of any swing in the given event year.
66.2
Bat Speed Avg
The average Bat Speed for all swings in the given event year.
61.3
Rotational Acceleration Max
The highest Rotational Acceleration of any swing in the given event year.
Rotational Acceleration Avg
The average Rotational Acceleration for all swings in the given event year.
On-Plane Efficiency Max
The highest On-Plane Efficiency of any swing in the given event year.
On-Plane Efficiency Avg
The average On-Plane Efficiency for all swings in the given event year.
AZ/CA/MV/PNW Workout Pod
Jul 28, 2021
Blast - Hitting
20.3
Hand Speed (max)
18.7
Hand Speed (avg)
63.9
Bat Speed (max)
59.2
Bat Speed (avg)
Rot. Acc (max)
Rot. Acc (avg)
On Plane Eff (avg)
2021 Future Games
Jul 28, 2021
Blast - Hitting
20.3
Hand Speed (max)
18.7
Hand Speed (avg)
63.9
Bat Speed (max)
59.2
Bat Speed (avg)
Rot. Acc (max)
Rot. Acc (avg)
On Plane Eff (avg)
MaxOnPlaneEfficiency
SoCal Underclass I.D. Camp
Oct 10, 2020
Blast - Hitting
21.2
Hand Speed (max)
19.3
Hand Speed (avg)
66.2
Bat Speed (max)
61.3
Bat Speed (avg)
Rot. Acc (max)
Rot. Acc (avg)
On Plane Eff (avg)
MaxOnPlaneEfficiency
Pitching
2023
2022
2021
2020
Fastball
Velocity Max
The maximum observed fastball velocity in the given event year. Measured in miles per hour (MPH).
89.9
Fastball
Velocity Avg
The average velocity for all pitches of this type in the given event year. Measured in miles per hour (MPH).
86.3
Fastball
Spin Rate Avg
The average rate of spin for all pitches of this type in the given event year. Measured in rotations per minute (RPM).
2175
Fastball
Spin Score Avg
The average Bauer Units value of all fastballs in the given event year. Bauer Units are calculated for each pitch by dividing Spin Rate by Velocity.
25.2
Fastball
Total Movement Avg
The average total non-gravity movement for all pitches of this type in the given event year. Measured in inches (in).
Curveball
Velocity Avg
The average velocity for all pitches of this type in the given event year. Measured in miles per hour (MPH).
73.8
Curveball
Spin Rate Avg
The average rate of spin for all pitches of this type in the given event year. Measured in rotations per minute (RPM).
2247
Curveball
Total Movement Avg
The average total non-gravity movement for all pitches of this type in the given event year. Measured in inches (in).
Changeup
Velocity Avg
The average velocity for all pitches of this type in the given event year. Measured in miles per hour (MPH).
78.1
Changeup
Spin Rate Avg
The average rate of spin for all pitches of this type in the given event year. Measured in rotations per minute (RPM).
1159
Changeup
Total Movement Avg
The average total non-gravity movement for all pitches of this type in the given event year. Measured in inches (in).
Slider
Velocity Avg
The average velocity for all pitches of this type in the given event year. Measured in miles per hour (MPH).
71.0
Slider
Spin Rate Avg
The average rate of spin for all pitches of this type in the given event year. Measured in rotations per minute (RPM).
2270
Slider
Total Movement Avg
The average total non-gravity movement for all pitches of this type in the given event year. Measured in inches (in).
Fastball
Velocity Max
The maximum observed fastball velocity in the given event year. Measured in miles per hour (MPH).
89.3
Fastball
Velocity Avg
The average velocity for all pitches of this type in the given event year. Measured in miles per hour (MPH).
86.8
Fastball
Spin Rate Avg
The average rate of spin for all pitches of this type in the given event year. Measured in rotations per minute (RPM).
2352
Fastball
Spin Score Avg
The average Bauer Units value of all fastballs in the given event year. Bauer Units are calculated for each pitch by dividing Spin Rate by Velocity.
27.1
Fastball
Total Movement Avg
The average total non-gravity movement for all pitches of this type in the given event year. Measured in inches (in).
Curveball
Velocity Avg
The average velocity for all pitches of this type in the given event year. Measured in miles per hour (MPH).
70.3
Curveball
Spin Rate Avg
The average rate of spin for all pitches of this type in the given event year. Measured in rotations per minute (RPM).
2368
Curveball
Total Movement Avg
The average total non-gravity movement for all pitches of this type in the given event year. Measured in inches (in).
Changeup
Velocity Avg
The average velocity for all pitches of this type in the given event year. Measured in miles per hour (MPH).
79.0
Changeup
Spin Rate Avg
The average rate of spin for all pitches of this type in the given event year. Measured in rotations per minute (RPM).
1743
Changeup
Total Movement Avg
The average total non-gravity movement for all pitches of this type in the given event year. Measured in inches (in).
Fastball
Velocity Max
The maximum observed fastball velocity in the given event year. Measured in miles per hour (MPH).
81.1
Fastball
Velocity Avg
The average velocity for all pitches of this type in the given event year. Measured in miles per hour (MPH).
79.2
Fastball
Spin Rate Avg
The average rate of spin for all pitches of this type in the given event year. Measured in rotations per minute (RPM).
2039
Fastball
Spin Score Avg
The average Bauer Units value of all fastballs in the given event year. Bauer Units are calculated for each pitch by dividing Spin Rate by Velocity.
25.7
Fastball
Total Movement Avg
The average total non-gravity movement for all pitches of this type in the given event year. Measured in inches (in).
Curveball
Velocity Avg
The average velocity for all pitches of this type in the given event year. Measured in miles per hour (MPH).
65.4
Curveball
Spin Rate Avg
The average rate of spin for all pitches of this type in the given event year. Measured in rotations per minute (RPM).
2180
Curveball
Total Movement Avg
The average total non-gravity movement for all pitches of this type in the given event year. Measured in inches (in).
Changeup
Velocity Avg
The average velocity for all pitches of this type in the given event year. Measured in miles per hour (MPH).
73.9
Changeup
Spin Rate Avg
The average rate of spin for all pitches of this type in the given event year. Measured in rotations per minute (RPM).
1761
Fastball
Velocity Max
The maximum observed fastball velocity in the given event year. Measured in miles per hour (MPH).
80.6
Fastball
Velocity Avg
The average velocity for all pitches of this type in the given event year. Measured in miles per hour (MPH).
79.5
Fastball
Spin Rate Avg
The average rate of spin for all pitches of this type in the given event year. Measured in rotations per minute (RPM).
2067
Fastball
Spin Score Avg
The average Bauer Units value of all fastballs in the given event year. Bauer Units are calculated for each pitch by dividing Spin Rate by Velocity.
26.0
Fastball
Total Movement Avg
The average total non-gravity movement for all pitches of this type in the given event year. Measured in inches (in).
Curveball
Velocity Avg
The average velocity for all pitches of this type in the given event year. Measured in miles per hour (MPH).
65.9
Curveball
Spin Rate Avg
The average rate of spin for all pitches of this type in the given event year. Measured in rotations per minute (RPM).
2163
Curveball
Total Movement Avg
The average total non-gravity movement for all pitches of this type in the given event year. Measured in inches (in).
Changeup
Velocity Avg
The average velocity for all pitches of this type in the given event year. Measured in miles per hour (MPH).
74.2
Changeup
Spin Rate Avg
The average rate of spin for all pitches of this type in the given event year. Measured in rotations per minute (RPM).
1791
Changeup
Total Movement Avg
The average total non-gravity movement for all pitches of this type in the given event year. Measured in inches (in).
2023 PBR ProCase - West
Jun 4, 2023
Trackman - Fastball
89.9
Velocity (max)
85.5 - 88.9
Velo Range
86.2
Eff Velocity (avg)
2,463
Spin Rate (max)
2,277
Spin Rate (avg)
IVB (max)
IVB (avg)
HM (max)
HM (avg)
Extension (avg)
Release Ht (avg)
Spin Score (max)
Zone %
Spin Efficiency % (avg)
Trackman - Curveball
77.3
Velocity (max)
72.3 - 76.3
Velo Range
72.4
Eff Velocity (avg)
2,312
Spin Rate (max)
2,228
Spin Rate (avg)
IVB (max)
IVB (avg)
HM (max)
HM (avg)
Extension (avg)
Release Ht (avg)
Spin Score (max)
Spin Efficiency % (avg)
Trackman - ChangeUp
75.6
Velocity (max)
73.7 - 75.6
Velo Range
73.4
Eff Velocity (avg)
791
Spin Rate (max)
760
Spin Rate (avg)
IVB (max)
IVB (avg)
HM (max)
HM (avg)
Extension (avg)
Release Ht (avg)
Spin Score (max)
Zone %
Spin Efficiency % (avg)
SoCal Preseason All-State Upperclass
Jan 8, 2023
Trackman - Fastball
87.2
Velocity (max)
83.4 - 87.2
Velo Range
82.3
Eff Velocity (avg)
2,289
Spin Rate (max)
2,090
Spin Rate (avg)
IVB (max)
IVB (avg)
HM (max)
HM (avg)
Extension (avg)
Release Ht (avg)
Spin Score (max)
Zone %
Spin Efficiency % (avg)
Trackman - Curveball
71.1
Velocity (max)
2,361
Spin Rate (max)
2,361
Spin Rate (avg)
Extension (avg)
Release Ht (avg)
Spin Score (max)
Spin Efficiency % (avg)
Trackman - Slider
72.9
Velocity (max)
69.9 - 72.2
Velo Range
67.1
Eff Velocity (avg)
2,349
Spin Rate (max)
2,270
Spin Rate (avg)
IVB (max)
IVB (avg)
HM (max)
HM (avg)
Extension (avg)
Release Ht (avg)
Spin Score (max)
Zone %
Spin Efficiency % (avg)
Trackman - ChangeUp
82.0
Velocity (max)
81.1 - 81.9
Velo Range
77.2
Eff Velocity (avg)
1,629
Spin Rate (max)
1,558
Spin Rate (avg)
IVB (max)
IVB (avg)
HM (max)
HM (avg)
Extension (avg)
Release Ht (avg)
Spin Score (max)
Zone %
Spin Efficiency % (avg)
2022 PBR Future Games
Jul 27, 2022
Trackman - Fastball
89.3
Velocity (max)
86.4 - 88.4
Velo Range
85.6
Eff Velocity (avg)
2,502
Spin Rate (max)
2,384
Spin Rate (avg)
Spin Score (max)
Trackman - Curveball
73.1
Velocity (max)
70.6 - 72.3
Velo Range
69.5
Eff Velocity (avg)
2,486
Spin Rate (max)
2,381
Spin Rate (avg)
Spin Score (max)
Trackman - ChangeUp
81.6
Velocity (max)
80.5 - 81.4
Velo Range
79.2
Eff Velocity (avg)
2,052
Spin Rate (max)
1,870
Spin Rate (avg)
Spin Score (max)
SoCal Preseason All-State Underclass
Jan 8, 2022
Trackman - Fastball
84.7
Velocity (max)
82.8 - 84.7
Velo Range
82.2
Eff Velocity (avg)
2,256
Spin Rate (max)
2,173
Spin Rate (avg)
IVB (max)
IVB (avg)
HM (max)
HM (avg)
Extension (avg)
Release Ht (avg)
Spin Score (max)
Zone %
Trackman - Curveball
66.6
Velocity (max)
65.0 - 66.4
Velo Range
63.2
Eff Velocity (avg)
2,393
Spin Rate (max)
2,314
Spin Rate (avg)
IVB (max)
IVB (avg)
HM (max)
HM (avg)
Extension (avg)
Release Ht (avg)
Spin Score (max)
Trackman - ChangeUp
76.4
Velocity (max)
74.9 - 76.3
Velo Range
73.8
Eff Velocity (avg)
1,935
Spin Rate (max)
1,516
Spin Rate (avg)
IVB (max)
IVB (avg)
HM (max)
HM (avg)
Extension (avg)
Release Ht (avg)
Spin Score (max)
Zone %
2021 Future Games
Jul 28, 2021
Trackman - Fastball
84.6
Velocity (max)
80.3 - 83.4
Velo Range
81.1
Eff Velocity (avg)
2,259
Spin Rate (max)
1,945
Spin Rate (avg)
Spin Score (max)
Trackman - Curveball
66.1
Velocity (max)
63.8 - 66.1
Velo Range
63.0
Eff Velocity (avg)
2,055
Spin Rate (max)
2,035
Spin Rate (avg)
Spin Score (max)
Trackman - ChangeUp
76.5
Velocity (max)
74.6 - 76.5
Velo Range
74.0
Eff Velocity (avg)
1,740
Spin Rate (max)
1,514
Spin Rate (avg)
Spin Score (max)
Preseason All-State (2023/2024)
Feb 6, 2021
Trackman - Fastball
81.1
Velocity (max)
77.8 - 80.6
Velo Range
77.6
Eff Velocity (avg)
2,176
Spin Rate (max)
2,039
Spin Rate (avg)
IVB (max)
IVB (avg)
HM (max)
HM (avg)
Extension (avg)
Release Ht (avg)
Spin Score (max)
Zone %
Trackman - Curveball
66.3
Velocity (max)
64.7 - 66.1
Velo Range
62.2
Eff Velocity (avg)
2,239
Spin Rate (max)
2,180
Spin Rate (avg)
IVB (max)
IVB (avg)
HM (max)
HM (avg)
Extension (avg)
Release Ht (avg)
Spin Score (max)
Zone %
Trackman - ChangeUp
73.9
Velocity (max)
1,761
Spin Rate (max)
1,761
Spin Rate (avg)
Extension (avg)
Release Ht (avg)
Spin Score (max)
SoCal Underclass I.D. Camp
Oct 10, 2020
Trackman - Fastball
80.6
Velocity (max)
78.7 - 80.3
Velo Range
77.6
Eff Velocity (avg)
2,116
Spin Rate (max)
2,067
Spin Rate (avg)
IVB (max)
IVB (avg)
HM (max)
HM (avg)
Extension (avg)
Release Ht (avg)
Spin Score (max)
Zone %
Trackman - Curveball
66.2
Velocity (max)
65.5 - 66.2
Velo Range
63.4
Eff Velocity (avg)
2,207
Spin Rate (max)
2,163
Spin Rate (avg)
IVB (max)
IVB (avg)
HM (max)
HM (avg)
Extension (avg)
Release Ht (avg)
Spin Score (max)
Zone %
Trackman - ChangeUp
75.0
Velocity (max)
73.2 - 75.0
Velo Range
72.8
Eff Velocity (avg)
1,890
Spin Rate (max)
1,791
Spin Rate (avg)
IVB (max)
IVB (avg)
HM (max)
HM (avg)
Extension (avg)
Release Ht (avg)
Spin Score (max)
Zone %
Pitch Scores
2021
2020
Fastball
Hop+
A fastball with hop has a flat approach angle and visually jumps through the zone. When thrown up in the zone, it is more likely to generate a higher swing and miss average. Hop+ of 100 is MLB average.
Fastball
Sink+
A fastball with sink has low backspin and drops through the strike zone. When thrown down in the zone, it is more likely to generate a higher ground ball percentage and lower launch angle. Sink+ of 100 is MLB average.
Fastball
Rise+
A fastball with rise has a high percentage of backspin. When thrown up in the zone, it is more likely to generate a higher fly ball percentage. Rise+ of 100 is MLB average
Curveball
Hammer+
A hammer breaking ball drops vertically with velocity through the zone, or 12-to-6 movement. Hammer+ of 100 is MLB average.
Curveball
Sweep+
A sweeping breaking ball moves horizontally with velocity through the zone. Sweep+ of 100 is MLB average.
Fastball
Hop+
A fastball with hop has a flat approach angle and visually jumps through the zone. When thrown up in the zone, it is more likely to generate a higher swing and miss average. Hop+ of 100 is MLB average.
Fastball
Sink+
A fastball with sink has low backspin and drops through the strike zone. When thrown down in the zone, it is more likely to generate a higher ground ball percentage and lower launch angle. Sink+ of 100 is MLB average.
Fastball
Rise+
A fastball with rise has a high percentage of backspin. When thrown up in the zone, it is more likely to generate a higher fly ball percentage. Rise+ of 100 is MLB average
Curveball
Hammer+
A hammer breaking ball drops vertically with velocity through the zone, or 12-to-6 movement. Hammer+ of 100 is MLB average.
Curveball
Sweep+
A sweeping breaking ball moves horizontally with velocity through the zone. Sweep+ of 100 is MLB average.
Pitching Velos
2023
2022
2021
2020
Fastball
Velocity Max
The maximum observed fastball velocity in the given event year. Measured in miles per hour (MPH).
90.0
Fastball
Velocity Avg
The average velocity for all pitches of this type in the given event year. Measured in miles per hour (MPH)
87.0
Curveball
Velocity Avg
The average velocity for all pitches of this type in the given event year. Measured in miles per hour (MPH)
74.0
Changeup
Velocity Avg
The average velocity for all pitches of this type in the given event year. Measured in miles per hour (MPH)
75.0
Fastball
Velocity Max
The maximum observed fastball velocity in the given event year. Measured in miles per hour (MPH).
85.0
Fastball
Velocity Avg
The average velocity for all pitches of this type in the given event year. Measured in miles per hour (MPH)
83.0
Curveball
Velocity Avg
The average velocity for all pitches of this type in the given event year. Measured in miles per hour (MPH)
65.5
Changeup
Velocity Avg
The average velocity for all pitches of this type in the given event year. Measured in miles per hour (MPH)
75.0
Fastball
Velocity Max
The maximum observed fastball velocity in the given event year. Measured in miles per hour (MPH).
85.0
Fastball
Velocity Avg
The average velocity for all pitches of this type in the given event year. Measured in miles per hour (MPH)
81.7
Curveball
Velocity Avg
The average velocity for all pitches of this type in the given event year. Measured in miles per hour (MPH)
66.0
Changeup
Velocity Avg
The average velocity for all pitches of this type in the given event year. Measured in miles per hour (MPH)
74.5
Fastball
Velocity Max
The maximum observed fastball velocity in the given event year. Measured in miles per hour (MPH).
81.0
Fastball
Velocity Avg
The average velocity for all pitches of this type in the given event year. Measured in miles per hour (MPH)
79.0
Curveball
Velocity Avg
The average velocity for all pitches of this type in the given event year. Measured in miles per hour (MPH)
65.5
Changeup
Velocity Avg
The average velocity for all pitches of this type in the given event year. Measured in miles per hour (MPH)
74.0
Game Performance
Vizual Edge
2021
Edge Score
The highest Edge Score within the given year. Edge Score is a comprehensive score that takes the core-six visual skills into account, providing an assessment of an athlete’s overall visual ability.
71.26
Pitch Ai
2022
Arm Speed
The maximum speed, in the direction of home plate, that the wrist is traveling. Measured in meters per second (m/s)
Arm Slot
Angle of the forearm relative to the ground between maximum external rotation (MER) and ball release (BR). Which can be a powerful player comparison metric, delivered in degrees.
Knee Extension Velo
The angular velocity of the front knee straightening after foot plant, which provides indicators of velocity potential. Measured in degrees per second.
Deception
The amount of time that the ball is visible to the hitter, after the instant of front foot strike. Measures in milliseconds.
Hip-Shoulder Separation
The difference in angle of between the hips and shoulders, occurring close to the foot plant. Measured in degrees.
2022 PBR Future Games
Jul 27, 2022
ProPlayAI - Foot Plant
Elbow Flexion (avg)
Shoulder Abduction (avg)
Hip Shoulder Seperation (avg)
ProPlayAI - MER
External Rotation (avg)
Stride Length (avg)
Horizontal Abduction (avg)
ProPlayAI - Release
Arm Speed (max)
Arm Speed (avg)
Knee Extension Velocity (max)
Knee Extension Velocity (avg)
Knee Flexion (avg)
Arm Slot (avg)
Lateral Trunk Tilt (avg)
Arm Path (avg)
Deception (avg)
Torque (avg)
Efficiency (avg)
Sequencing (avg)
SoCal Preseason All-State Underclass
Jan 8, 2022
ProPlayAI - Foot Plant
Elbow Flexion (avg)
Shoulder Abduction (avg)
Hip Shoulder Seperation (avg)
ProPlayAI - MER
External Rotation (avg)
Stride Length (avg)
Horizontal Abduction (avg)
ProPlayAI - Release
Arm Speed (max)
Arm Speed (avg)
Knee Extension Velocity (max)
Knee Extension Velocity (avg)
Knee Flexion (avg)
Arm Slot (avg)
Lateral Trunk Tilt (avg)
Arm Path (avg)
Deception (avg)
Torque (avg)
Efficiency (avg)
Sequencing (avg)
AZ/CA/MV/PNW Workout Pod
Jul 28, 2021
ProPlayAI - Foot Plant
Elbow Flexion (avg)
Shoulder Abduction (avg)
Hip Shoulder Seperation (avg)
ProPlayAI - MER
External Rotation (avg)
Stride Length (avg)
Horizontal Abduction (avg)
ProPlayAI - Release
Arm Speed (max)
Arm Speed (avg)
Knee Extension Velocity (max)
Knee Extension Velocity (avg)
Knee Flexion (avg)
Lateral Trunk Tilt (avg)
Arm Path (avg)
Deception (avg)
Torque (avg)
Efficiency (avg)
Sequencing (avg)
2021 Future Games
Jul 28, 2021
ProPlayAI - Foot Plant
Elbow Flexion (avg)
Shoulder Abduction (avg)
Hip Shoulder Seperation (avg)
ProPlayAI - MER
External Rotation (avg)
Stride Length (avg)
Horizontal Abduction (avg)
ProPlayAI - Release
Arm Speed (max)
Arm Speed (avg)
Knee Extension Velocity (max)
Knee Extension Velocity (avg)
Knee Flexion (avg)
Lateral Trunk Tilt (avg)
Arm Path (avg)
Deception (avg)
Torque (avg)
Efficiency (avg)
Sequencing (avg)
Notes
News
- West Coast ProCase: Pitching Data Dive - Jun 15, 2023
- SoCal Preseason All-State Upperclass Trackman Files: Offspeed - Jan 24, 2023
- SoCal Preseason All-State Upperclass Trackman Files: Fastball - Jan 19, 2023
- SoCal Preseason All-State Upperclass: Speed/Fielding Stats - Jan 12, 2023
- SoCal Preseason All-State Upperclass: Swift Technology Leaderboard - Jan 10, 2023
- Updated Class of 2024 Rankings - Aug 25, 2022
- SoCal Preseason All-State Underclass: Quick Hits - Jan 12, 2022
- Team CA Future Games: Day 3 Recap - Jul 30, 2021
- Team California Roster - Jul 25, 2021
- Preseason All-State: Scouting Reports - Underclass Pitchers - Feb 19, 2021
- SoCal ID Camp Underclass Black - Outfielders - Nov 9, 2020
Comments
Draft Reports
Contact
Premium Content Area
To unlock contact information, you need to purchase a ScoutPLUS subscription.
Purchase Subscription OR
Login

Sign in to view rankings
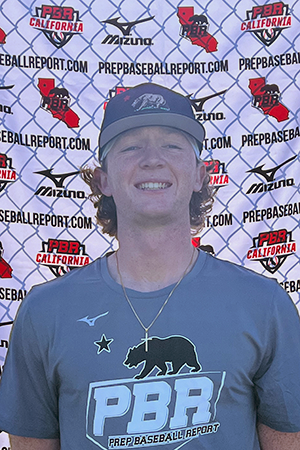
Body: 6-3/200lbs. Larger frame. Lean and high waisted. Long limbs. Still some projection. Starter's build.
Delivery: Smooth delivery. Side steps into a chest high knee tuck. Smaller driveleg sit. Lower half works in-line. Creates good downhill force. Quality block into landing. Level shoulders. Still head. Repeats well.
Arm Action: Hand lead path. Loose circle. Gets into some quality scap load. Decent layback. Easy arm speed. Works to a H 3/4 slot.
FB: 85-87. Mixed 2-seam/4-seam. 4-seam showed decent carry (21.4 inch max). 2-seam maxed out at about 15 inches of run. Filled it up especially to the gloveside.
SL: 69-72: Larger breaker. About 13 inches of sweep and 8 inches of drop. Consistent slot/armspeed. Consistently below the zone and induced chase/whiff.
CH: 81-82: Kills about 5-7 inches of VB off FB. More of a straight change that flashed some fade (13 inch max HB).
Positional Profile: RHP/OF
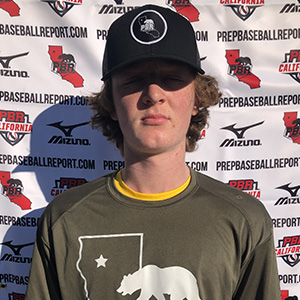
Body: 6-3, 190-pounds. Pitchers build. High-waisted, 6' 3" 190lb frame that features some strength. Will be an exciting follow as the body comes into its own.
Delivery: Loose and relaxed delivery that gives off the illusion of extremely low effort. Glides through leg lift and begins to corkscrew into the ground with backside at the peak. Keeps back foot connected and rides the rear glute efficiently. Hips, shoulders, and arms rotate efficiently on the same plane.
Arm Action: Shorter arm action that is loose, clean, and repeatable. Gets up on time and is in a good position to impart spin on the ball. Leverages the pec and does a good job accelerating through release. Clean deceleration.
FB: T85, 82-84 mph. Outlier fastball movement with an average of 22.8" of induced vertical break at 83.8 MPH. Pitch should get whiffs and miss barrels up in the zone.
CB: 65-66 mph. Slow, downer CB dominated by drop (12.3") with some sweep (5.9"). Spun at an average of 2323 rpm. Movement plays well with fastball characteristics and pitches could tunnel well if located.
CH: 74-76 mph. Straight change, averaging a 9MPH velocity difference with a small differential in movement. Pitch relies mainly on velocity difference/ deception to miss bats. Showed the ability to throw for strikes consistently.
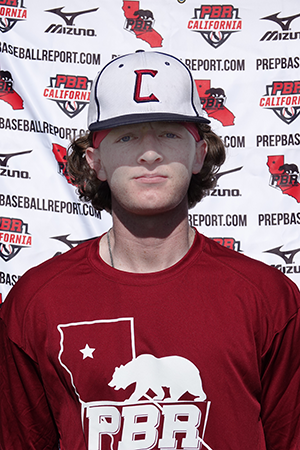
Body: 6-2, 175-pounds. Projectable frame with lots of length and lean strength currently; athleticism to make strides quickly.
Delivery: Athletic delivery with very high front knee; hands breaking on the knee. Generally down the hill with good extension especially on FB.
Arm Action: RH. Full swing with depth out to 3/4 release. Kept a consistent release point for all pitches and held velocity over two innings pitched.
FB: T81.1, 77-80 mph. Will get some ride with vertical break (19.5 Vertical Max). Pitched enough in the zone, times where he battled control
CB: 64-66 mph. Overhand shape, plays well off riding FB with good vertical break and better spin for the age; developable pitch.
CH: 73 mph. Sold it well; didn't use it much and looks like it could be a solid third pitch.
Body: 6-2, 170-pounds. Long and lean athletic build with room to fill out.
Hit: RHH. Narrow straight base with an upright upper body in stance. Utilizes a toe tap trigger. Smooth stroke that works on a level plane (72% on plane efficiency). Gets out in front of balls with a higher hand finish. Pullside approach.
Power: 79 mph exit velocity. Current singles hitter.
Arm: RH. OF - 82 mph. Longer arm action. Throws flashed good carry to the target. some throws were on the fly. Releases on an upward angle so throws had air under them. Quick to release.
Defense: Athleticism showed with good defensive actions. Quick feet and took good angles to get around and through the ball. Clean exchanges and got feet under him quickly to make his throws.
Run: 7.31 runner in the 60.
Delivery: Throws from the stretch. Drop and drive delivery. Up and down knee lift and gets a good large stride. Steps slightly closed. Firms up front leg while rear leg sweeps through. In good fielding position at landing..
Arm Action: RH. Longer arm action that comes out of the H 3/4 slot. Gets into a slight inverted W/scalp load. Arm accelerates late in the action. Drops slot slightly on CB. Consistent arm speed on all pitches.
FB: T81, 78-80 mph. Trouble locating it to the glove side. Gets his best extension on FB.
CB: 65-66 mph. Very minimal horizontal break. Decent spin at around 2200 rpm.
CH: 73-75 mph. Nice armside fade late in the action.