CLASS OF 2025
C
2B
Landon
Hodge
Crespi Carmelite (HS) • CA
6' 0" • 199.3LBS
L/R • 18yr 2mo

L/R • 18yr 2mo
Rankings
2025 National
Rankings available to Premium Subscriber
2025 State
Rankings available to Premium Subscriber
Commitment
Best Of Stats

21.6
Hand Speed (max)
6/02/24
71.8
Bat Speed (max)
6/02/24
16.3
Rot. Acc (max)
6/02/24
50
Hard Hit %
6/02/24

96.6
Exit Velocity (max)
6/02/24
85.3
Exit Velocity (avg)
6/02/24
359
Distance (max)
6/02/24
36
Sweet Spot %
6/02/24

6.87
60-yd
6/02/24
3.84
30-yd
6/02/24
1.72
10-yd
6/02/24
20.3
Run speed (max)
6/02/24

-
INF Velo
-
OF Velo
83
C Velo
6/02/24
1.93 - 1.97
Pop Time
6/02/24
Positional Tools
2024
Pop Time
The athlete's fastest pop time in the given event year. Measured from glove to glove, in seconds (s).
1.93 - 1.97
Catcher Velocity
The athlete's maximum throwing velocity from the catcher position in the given event year. Measured in miles per hour (MPH).
83.0
Hitting

2024
Exit Velocity Max
The highest exit velocity of any batted ball in the given event year. Measured in miles per hour (MPH).
96.6
Exit Velocity Avg
Average exit velocity of all batted balls in the given event year. Measured in miles per hour (MPH).
85.3
Distance Max
The highest flight distance of any batted ball in the given event year. Measured in feet (ft).
359
Distance Avg
Average flight distance of all batted balls in the given event year. Measured in feet (ft).
279
Launch Angle Avg
Average launch angle of all batted balls in the given event year. Measured in degrees.
37.1304
Hard Hit %
Percentage of batted balls with exit velocities over 95 MPH in the given event year.
Sweet Spot %
Percentage of batted balls in the given event year with a launch angle between 8° and 32°.
Line Drive %
Percentage of batted balls with launch angles between 10 and 25 degrees in the given event year.
Fly Ball %
Percentage of batted balls with launch angles between 25 and 50 degrees in the given event year.
Ground Ball %
Percentage of batted balls with launch angles below 10 degrees in the given event year.
2024 ProCase - West
Jun 2, 2024
Trackman - Hitting
96.6
Exit Velocity (max)
85.3
Exit Velocity (avg)
279
Distance (avg)
359
Distance (max)
Hard Hit %
Sweet Spot %
Line Drive %
Fly Ball %
Hitting

2024
Hand Speed Max
The highest Peak Hand Speed of any swing in the given event year.
21.6
Hand Speed Avg
The average Peak Hand Speed for all swings in the given event year.
21.0
Bat Speed Max
The highest Bat Speed of any swing in the given event year.
71.8
Bat Speed Avg
The average Bat Speed for all swings in the given event year.
68.4
Rotational Acceleration Max
The highest Rotational Acceleration of any swing in the given event year.
Rotational Acceleration Avg
The average Rotational Acceleration for all swings in the given event year.
On-Plane Efficiency Max
The highest On-Plane Efficiency of any swing in the given event year.
On-Plane Efficiency Avg
The average On-Plane Efficiency for all swings in the given event year.
2024 ProCase - West
Jun 2, 2024
Blast - Hitting
21.6
Hand Speed (max)
21.0
Hand Speed (avg)
71.8
Bat Speed (max)
68.4
Bat Speed (avg)
Rot. Acc (max)
Rot. Acc (avg)
On Plane Eff (avg)
MaxOnPlaneEfficiency
Pitching

Pitch Scores
Pitching Velos
Game Performance

2024
10 Yard Dash
The athlete's fastest 0-10-yard split time in the given event year. Measured in seconds.
1.72
30 Yard Dash
The athlete's fastest 0-30-yard split time in the given event year. Measured in seconds.
3.84
60 Yard Dash
The athlete's fastest 0-60-yard time in the given event year. Measured in seconds.
6.87
Top Speed (MPH)
The athlete's fastest split time converted to miles per hour.
RSi
The reactive strength index measurement of an athlete's explosiveness by comparing their jump height to the ground contact time in between their jumps. On a scale of 0-5.
Vertical Jump
A measure of any athlete's body strength and reach calculated from the flight time divided by the contact time.
2024 ProCase - West
Jun 2, 2024
Swift
1.72
10-yd
3.84
30-yd
6.87
60-yd
20.3
Run speed (max)
1.39
RSI (max)
33.0
Jump Height (max)

Vizual Edge

2024
Edge Score
The highest Edge Score within the given year. Edge Score is a comprehensive score that takes the core-six visual skills into account, providing an assessment of an athlete’s overall visual ability.
74.86
Pitch Ai

Notes
News
Comments
Draft Reports
Contact
Premium Content Area
To unlock contact information, you need to purchase a ScoutPLUS subscription.
Purchase Subscription OR
Login
Physical
2024
Grip Strgth (LH)
Grip strength is a measure of a players bat control and ability to transfer power and speed during impact, measured in pounds of force generated; collected with elbow bent at 90 degrees.
Grip Strgth (RH)
Grip strength is a measure of a players bat control and ability to transfer power and speed during impact, measured in pounds of force generated; collected with elbow bent at 90 degrees.
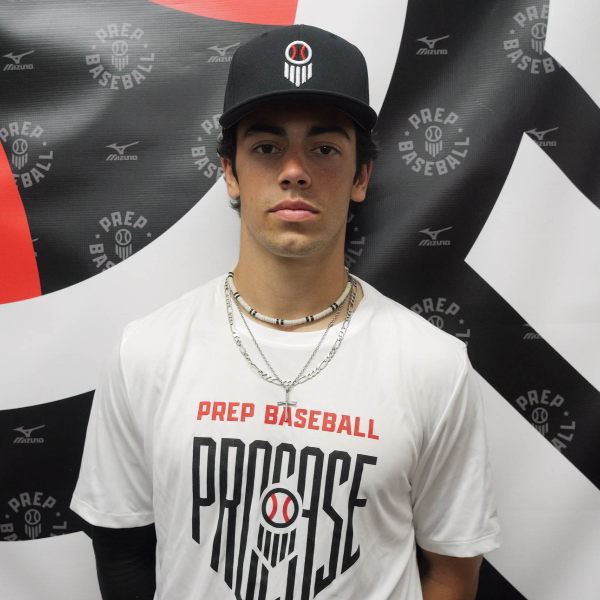
Landon Hodge, Crespi Carmelite (CA), 2025 Stanford
Positional Profile: C/2B Catch and throw defender who shows athleticism and offensive potential from LH side
Body: 6-0, 199-pounds. Medium sized frame with some present strength throughout
Hit: LHH. Balanced even stance with small crouch/hip hinge while setting hands just above shoulder height right near rear shoulder with a higher back elbow and bat tip angled forward Small leg kick with a shift into the back hip during load with small hand movement into a small stride that lands balanced at launch. Swing sequences well with lower 1/2 turn while keeping hands back and showing ability to stay behind the baseball. Path is slightly uphill with leverage to the pull side and contact plays best middle to pull side.
Power: 97 max exit velocity, averaged 85.3 mph. 359' max distance. Effectively gets the baseball in the air with authority that shows pull side HR power with lift in his bat path.
Arm: RH. C-83 mph. Quickness in the transfer with arm speed that shows low carry out of the hand with present arm strength.
Defense: 1.93-1.97 pop times. Solid receiver who shows feel for pitch presentation and actions in the block. Feet will flash athleticism in throwing motion.
ATH: 6.87 runner in the 60. 1.72 and 3.84 in the 10 and 30 yard splits. good burst off the line with ability to maintain speed throughout 33.00 max vertical.