CLASS OF 2023
3B
SS
Aidan
Miller
Arkansas
JW Mitchell (HS) • FL
6' 2" • 205LBS
R/R • 21yr 7mo
Travel Team: Top Tier Roos
JW Mitchell (HS) • FL
6' 2" • 205LBS
R/R • 21yr 7mo
Travel Team: Top Tier Roos
Rankings
2023 National
Rankings available to Premium Subscriber
2023 State
Rankings available to Premium Subscriber
Commitment
Best Of Stats
25.4
Hand Speed (max)
12/18/20
81.9
Bat Speed (max)
12/18/20
26.2
Rot. Acc (max)
12/18/20
67
Hard Hit %
2/13/23
104.8
Exit Velocity (max)
2/13/23
92.6
Exit Velocity (avg)
2/13/23
393
Distance (max)
2/13/23
63
Sweet Spot %
12/18/20
7.00
60-yd
12/18/20
-
30-yd
-
10-yd
-
Run speed (max)
87
INF Velo
12/13/19
91
OF Velo
12/18/20
-
C Velo
-
Pop Time
Fastball
95
Velocity (max)
6/10/21
90 - 93
Velo Range
6/10/21
2104
Spin Rate (avg)
12/18/20
Curveball
76 - 78
Velo Range
4/08/21
-
Spin Rate (avg)
High School
Apr 8, 2021
Wilson Premier Classic 2020
Sep 14, 2020
Positional Tools
2020
2019
60 Yard Dash
The athlete's fastest 60-yard dash time in the given event year. Measured in seconds (s)
7.00
Outfield Velocity
The athlete's maximum throwing velocity from an outfield position in the given event year. Measured in miles per hour (MPH).
91.0
Power / Speed Score
A simple calculation that divides the athlete’s Exit Velocity Max by the athlete’s 60 Yard Dash time for the given event year. For example, 98 MPH / 7.00s = 14.00.
14.7
60 Yard Dash
The athlete's fastest 60-yard dash time in the given event year. Measured in seconds (s)
7.15
Infield Velocity
The athlete's maximum throwing velocity from an infield position in the given event year. Measured in miles per hour (MPH).
87.0
Outfield Velocity
The athlete's maximum throwing velocity from an outfield position in the given event year. Measured in miles per hour (MPH).
88.0
Power / Speed Score
A simple calculation that divides the athlete’s Exit Velocity Max by the athlete’s 60 Yard Dash time for the given event year. For example, 98 MPH / 7.00s = 14.00.
14.0
Hitting
2023
2020
Exit Velocity Max
The highest exit velocity of any batted ball in the given event year. Measured in miles per hour (MPH).
104.8
Exit Velocity Avg
Average exit velocity of all batted balls in the given event year. Measured in miles per hour (MPH).
92.6
Distance Max
The highest flight distance of any batted ball in the given event year. Measured in feet (ft).
393
Distance Avg
Average flight distance of all batted balls in the given event year. Measured in feet (ft).
241
Launch Angle Avg
Average launch angle of all batted balls in the given event year. Measured in degrees.
21.2
Hard Hit %
Percentage of batted balls with exit velocities over 95 MPH in the given event year.
Sweet Spot %
Percentage of batted balls in the given event year with a launch angle between 8° and 32°.
Line Drive %
Percentage of batted balls with launch angles between 10 and 25 degrees in the given event year.
Fly Ball %
Percentage of batted balls with launch angles between 25 and 50 degrees in the given event year.
Ground Ball %
Percentage of batted balls with launch angles below 10 degrees in the given event year.
Exit Velocity Max
The highest exit velocity of any batted ball in the given event year. Measured in miles per hour (MPH).
102.6
Exit Velocity Avg
Average exit velocity of all batted balls in the given event year. Measured in miles per hour (MPH).
91.5
Distance Max
The highest flight distance of any batted ball in the given event year. Measured in feet (ft).
333
Distance Avg
Average flight distance of all batted balls in the given event year. Measured in feet (ft).
243
Launch Angle Avg
Average launch angle of all batted balls in the given event year. Measured in degrees.
17.4
Hard Hit %
Percentage of batted balls with exit velocities over 95 MPH in the given event year.
Sweet Spot %
Percentage of batted balls in the given event year with a launch angle between 8° and 32°.
Line Drive %
Percentage of batted balls with launch angles between 10 and 25 degrees in the given event year.
Fly Ball %
Percentage of batted balls with launch angles between 25 and 50 degrees in the given event year.
Ground Ball %
Percentage of batted balls with launch angles below 10 degrees in the given event year.
2023 Preseason Classic BP
Feb 13, 2023
Trackman - Hitting
104.8
Exit Velocity (max)
92.6
Exit Velocity (avg)
241
Distance (avg)
393
Distance (max)
Hard Hit %
Sweet Spot %
Line Drive %
Fly Ball %
Ground Ball %
Top Tier Roos Tryout
Dec 18, 2020
Trackman - Hitting
102.6
Exit Velocity (max)
91.5
Exit Velocity (avg)
243
Distance (avg)
333
Distance (max)
Hard Hit %
Sweet Spot %
Line Drive %
Fly Ball %
Ground Ball %
Hitting
2020
Hand Speed Max
The highest Peak Hand Speed of any swing in the given event year.
25.4
Hand Speed Avg
The average Peak Hand Speed for all swings in the given event year.
24.2
Bat Speed Max
The highest Bat Speed of any swing in the given event year.
81.9
Bat Speed Avg
The average Bat Speed for all swings in the given event year.
78.7
Rotational Acceleration Max
The highest Rotational Acceleration of any swing in the given event year.
Rotational Acceleration Avg
The average Rotational Acceleration for all swings in the given event year.
On-Plane Efficiency Max
The highest On-Plane Efficiency of any swing in the given event year.
On-Plane Efficiency Avg
The average On-Plane Efficiency for all swings in the given event year.
Top Tier Roos Tryout
Dec 18, 2020
Blast - Hitting
25.4
Hand Speed (max)
24.2
Hand Speed (avg)
81.9
Bat Speed (max)
78.7
Bat Speed (avg)
Rot. Acc (max)
Rot. Acc (avg)
On Plane Eff (avg)
MaxOnPlaneEfficiency
Pitching
2020
Fastball
Velocity Max
The maximum observed fastball velocity in the given event year. Measured in miles per hour (MPH).
92.5
Fastball
Velocity Avg
The average velocity for all pitches of this type in the given event year. Measured in miles per hour (MPH).
91.0
Fastball
Spin Rate Avg
The average rate of spin for all pitches of this type in the given event year. Measured in rotations per minute (RPM).
2104
Fastball
Spin Score Avg
The average Bauer Units value of all fastballs in the given event year. Bauer Units are calculated for each pitch by dividing Spin Rate by Velocity.
23.1
Fastball
Total Movement Avg
The average total non-gravity movement for all pitches of this type in the given event year. Measured in inches (in).
Top Tier Roos Tryout
Dec 18, 2020
Trackman - Fastball
92.5
Velocity (max)
90.0 - 92.1
Velo Range
89.7
Eff Velocity (avg)
2,226
Spin Rate (max)
2,104
Spin Rate (avg)
IVB (max)
IVB (avg)
HM (max)
HM (avg)
Extension (avg)
Release Ht (avg)
Spin Score (max)
Zone %
Pitch Scores
2020
Fastball
Hop+
A fastball with hop has a flat approach angle and visually jumps through the zone. When thrown up in the zone, it is more likely to generate a higher swing and miss average. Hop+ of 100 is MLB average.
Fastball
Sink+
A fastball with sink has low backspin and drops through the strike zone. When thrown down in the zone, it is more likely to generate a higher ground ball percentage and lower launch angle. Sink+ of 100 is MLB average.
Fastball
Rise+
A fastball with rise has a high percentage of backspin. When thrown up in the zone, it is more likely to generate a higher fly ball percentage. Rise+ of 100 is MLB average
Pitching Velos
2021
2020
2019
Fastball
Velocity Max
The maximum observed fastball velocity in the given event year. Measured in miles per hour (MPH).
95.0
Fastball
Velocity Avg
The average velocity for all pitches of this type in the given event year. Measured in miles per hour (MPH)
91.5
Fastball
Velocity Max
The maximum observed fastball velocity in the given event year. Measured in miles per hour (MPH).
93.0
Fastball
Velocity Avg
The average velocity for all pitches of this type in the given event year. Measured in miles per hour (MPH)
91.0
Fastball
Velocity Max
The maximum observed fastball velocity in the given event year. Measured in miles per hour (MPH).
86.0
Fastball
Velocity Avg
The average velocity for all pitches of this type in the given event year. Measured in miles per hour (MPH)
84.0
Game Performance
Vizual Edge
Pitch Ai
Notes
News
- 2023 MLB Draft: Midseason Mock Draft - Apr 13, 2023
- 2023 PBR Draft Board: Midseason Update - Apr 12, 2023
- East vs. West (MLB Draft Prospects) - Feb 21, 2023
- 2023 Power25 Countdown: No. 8 Mitchell - Feb 1, 2023
- MLB Draft: Preseason 1:1 Potential - Jan 5, 2023
- Most Viewed Profiles of 2022: No. 4 Aidan Miller - Dec 27, 2022
- MLB Draft 2023: Winter's Mock Draft - Dec 7, 2022
- 2023 National Rankings Updated - Nov 4, 2022
- Florida 2023 Rankings: Post Fall Update - Nov 3, 2022
- 2023 Overall Rankings Update - Sep 9, 2022
- 2023 Rankings Week - Sep 8, 2022
- Florida 2023 Rankings Update - Sep 5, 2022
- NPI Draft Headliners (2023) - Jun 16, 2022
- Litsch's Lookback: Week 6 - Apr 6, 2022
- Florida 2023 Rankings Update - Mar 31, 2022
- No. 23 Mitchell Continues to Roll in Win over No. 16 Wharton - Mar 30, 2022
- Mitchell Walks Off No. 14 George Jenkins - Mar 24, 2022
- Most Viewed Profiles of 2021: No. 4 Aidan Miller - Dec 28, 2021
- Florida 2023 Rankings Update - Dec 23, 2021
- 2023 Overall Rankings UPDATE - Sep 3, 2021
- Florida 2023 Rankings Update - Sep 1, 2021
- 2021 PBR FL High School All-State Teams - Jul 2, 2021
- Litsch's Lookback: Week 8 - Apr 14, 2021
- Mitchell Upsets Berkeley Prep 4-3 - Apr 9, 2021
- Florida 2023 Rankings Update - Apr 8, 2021
- 2021 Power25 Countdown: No. 21 Mitchell - Jan 20, 2021
- Most Viewed Profiles of 2020: No. 2 Aidan Miller - Jan 15, 2021
- Top Tier Roos Tryouts: Standouts - Jan 7, 2021
- Best of 2020: Fastball Velo - Jan 4, 2021
- Florida 2023 Rankings Update - Dec 28, 2020
- Top Tier Roos Tryout: Statistical Analysis - Dec 22, 2020
- Florida 2023 Rankings Update - Oct 9, 2020
- 2023 Overall Rankings Updated & Expanded - Sep 24, 2020
- Top Tier Roos Tryouts: Standouts - Aug 18, 2020
- Florida 2023 Rankings Update: Risers & Newcomers - May 13, 2020
- 2023 Rankings Updated & Expanded - May 12, 2020
- No 8 Mitchell Defeats Dunedin 9-3 - Feb 18, 2020
- Power25 Countdown: No 8 Mitchell - Feb 13, 2020
- Top Tier Roos Tryout Standouts - Dec 18, 2019
- Top Tier Roos Tryouts: Statistical Analysis - Dec 16, 2019
- Florida Class of 2023 Initial Rankings Release - Nov 12, 2019
- Initial 2023 Overall Rankings Release - Nov 7, 2019
- Florida State Games (2022-2023) - Jun 5, 2019
- Florida State Games 14U/15U Day One Recap - Jun 2, 2019
- Top Tier Roos Tryouts - Standout 2022/23s - Dec 13, 2018
- Jr. Future Series - Winter Championship: Standouts - Dec 4, 2018
Comments
Draft Reports
Contact
Premium Content Area
To unlock contact information, you need to purchase a ScoutPLUS subscription.
Purchase Subscription OR
Login

Sign in to view rankings
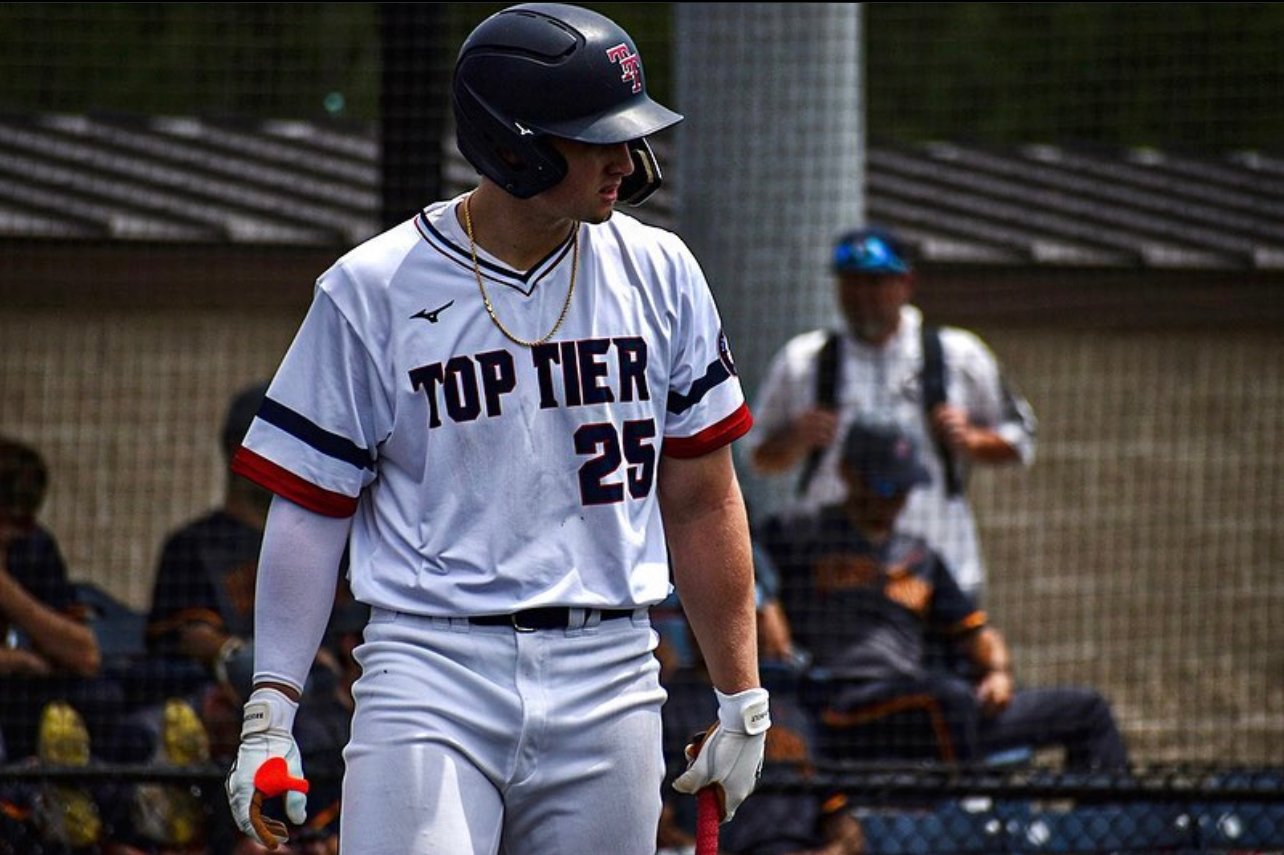
The top right-handed-hitting prep player brings considerable power potential with an even better chance to hit on the next stage. A run-producer who digs in with fearless intent and can drive the ball to all fields.
The Arkansas recruit was a force and catalyst in helping Team USA capture a gold medal at the World Cup early on in the fall. His physicality and athleticism provide natural plate coverage with present strength to all fields and exciting upside as a middle-of-the-order bat.
3B Aidan Miller (JW Mitchell HS, FL), an Arkansas recruit, has carried the spotlight as one of the top prospects in the class since the day he stepped foot in high school. Always a consummate performer, Miller hardly rested on his talents, but rather raised them to new heights. Now, a sturdy 6-foot-2, 205-pound athlete, the right-handed hitter has emerged as an elite bat in the class with the ability to drive the ball to all fields with authority.
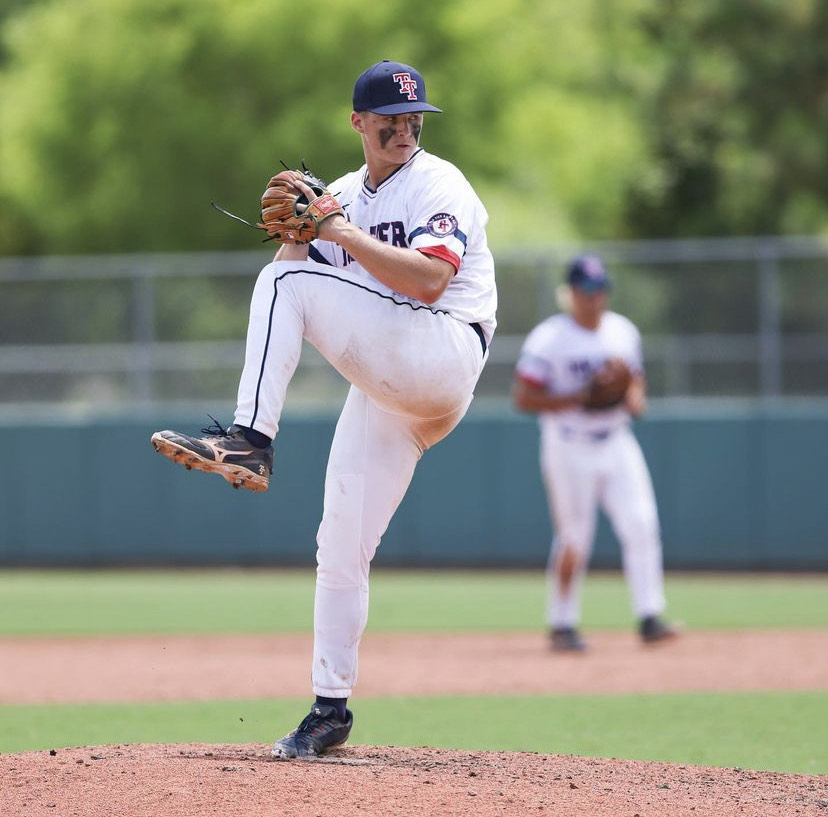
Miller’s upside is off the charts. Continues to get bigger and stronger each time I see him. Was up to 91 from the outfield with a loose arm. Offensively, drives the ball to both gaps with ease. Above average power potential. Shows above average bat speed. On the mound was up to 93 mph with little effort. Miller is committed to Arkansas and has top round potential in the 2023 Draft.
Physical, athletic frame. Continues to show elite bat to ball skills. Low effort swing that produces consistent high exit velo’s. All-around upside is off the charts as he has an above average glove and above average arm defensively. On the mound, Miller sat 88-90 with ease.
5-foot-11, 165-pounds with a lean, athletic frame. Advanced approach from the left side with natural flow to the load and quick hands. Drove a double deep to left field against the wind, and looks the part of an elite prospect in the class. Roamed centerfield with ease, and showed off a strong throwing arm with carry that included multiple attempts to throw out runners at first base on hits. A threat at the plate in every at-bat.
5-foot-11, 165-pound, right-handed two-way prospect, athletically-built, long, lanky frame, wide shoulders, highly projectable. Offensively, narrow, open setup, leg kick timing trigger, hands drop and go back on load, explosive lower half at-times, maintains good balance. Gap-to-gap type hitter with pull-side power, quick hand speed, strong wrists, 90 mph exit velocity. Ran a 7.15 60. High follow 2023. Defensively, advanced arm strength for age, arm plays short and athletically, clean on the back-side.