CLASS OF 2020
RHP
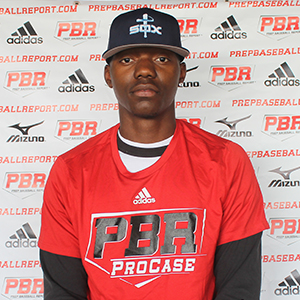
Isaiah
Jackson
Missouri
Champaign Central (HS) • IL
6' 5" • 205LBS
R/R • 24yr 4mo
Travel Team: East Coast Sox
Champaign Central (HS) • IL
6' 5" • 205LBS
R/R • 24yr 4mo
Travel Team: East Coast Sox
Rankings
2020 National
Rankings available to Premium Subscriber
2020 State
Rankings available to Premium Subscriber
Commitment
Best Of Stats
Fastball
97
Velocity (max)
9/15/22
93 - 97
Velo Range
9/15/22
2081
Spin Rate (avg)
2/02/20
Changeup
78 - 82
Velo Range
9/15/22
1530
Spin Rate (avg)
2/02/20
Curveball
69 - 71
Velo Range
2/02/20
2012
Spin Rate (avg)
2/02/20
Slider
73.6 - 80.4
Velo Range
9/15/22
2310
Spin Rate (avg)
9/15/22
98.3
Exit Velocity (max)
2/02/20
82.7
Exit Velocity (avg)
2/02/20
315
Distance (max)
2/02/20
58
Sweet Spot %
2/02/20
-
Hand Speed (max)
-
Bat Speed (max)
-
Rot. Acc (max)
33
Hard Hit %
2/02/20
6.63
60-yd
2/10/19
-
30-yd
-
10-yd
-
Run speed (max)
-
INF Velo
95
OF Velo
2/02/20
-
C Velo
-
Pop Time
Positional Tools
2020
2019
60 Yard Dash
The athlete's fastest 60-yard dash time in the given event year. Measured in seconds (s)
6.87
Outfield Velocity
The athlete's maximum throwing velocity from an outfield position in the given event year. Measured in miles per hour (MPH).
95.0
Power / Speed Score
A simple calculation that divides the athlete’s Exit Velocity Max by the athlete’s 60 Yard Dash time for the given event year. For example, 98 MPH / 7.00s = 14.00.
14.3
60 Yard Dash
The athlete's fastest 60-yard dash time in the given event year. Measured in seconds (s)
6.63
Outfield Velocity
The athlete's maximum throwing velocity from an outfield position in the given event year. Measured in miles per hour (MPH).
93.0
Power / Speed Score
A simple calculation that divides the athlete’s Exit Velocity Max by the athlete’s 60 Yard Dash time for the given event year. For example, 98 MPH / 7.00s = 14.00.
14.3
Hitting

2020
Exit Velocity Max
The highest exit velocity of any batted ball in the given event year. Measured in miles per hour (MPH).
98.3
Exit Velocity Avg
Average exit velocity of all batted balls in the given event year. Measured in miles per hour (MPH).
82.7
Distance Max
The highest flight distance of any batted ball in the given event year. Measured in feet (ft).
315
Distance Avg
Average flight distance of all batted balls in the given event year. Measured in feet (ft).
201
Launch Angle Avg
Average launch angle of all batted balls in the given event year. Measured in degrees.
20.7
Hard Hit %
Percentage of batted balls with exit velocities over 95 MPH in the given event year.
Sweet Spot %
Percentage of batted balls in the given event year with a launch angle between 8° and 32°.
Line Drive %
Percentage of batted balls with launch angles between 10 and 25 degrees in the given event year.
Fly Ball %
Percentage of batted balls with launch angles between 25 and 50 degrees in the given event year.
Ground Ball %
Percentage of batted balls with launch angles below 10 degrees in the given event year.
Super 60 Pro Showcase
Feb 2, 2020
Trackman - Hitting
98.3
Exit Velocity (max)
82.7
Exit Velocity (avg)
201
Distance (avg)
315
Distance (max)
Hard Hit %
Sweet Spot %
Line Drive %
Fly Ball %
Ground Ball %
Hitting

Pitching

2022
2020
Fastball
Velocity Max
The maximum observed fastball velocity in the given event year. Measured in miles per hour (MPH).
96.8
Fastball
Velocity Avg
The average velocity for all pitches of this type in the given event year. Measured in miles per hour (MPH).
94.8
Fastball
Spin Rate Avg
The average rate of spin for all pitches of this type in the given event year. Measured in rotations per minute (RPM).
1970
Fastball
Spin Score Avg
The average Bauer Units value of all fastballs in the given event year. Bauer Units are calculated for each pitch by dividing Spin Rate by Velocity.
20.8
Fastball
Total Movement Avg
The average total non-gravity movement for all pitches of this type in the given event year. Measured in inches (in).
Changeup
Velocity Avg
The average velocity for all pitches of this type in the given event year. Measured in miles per hour (MPH).
79.8
Changeup
Spin Rate Avg
The average rate of spin for all pitches of this type in the given event year. Measured in rotations per minute (RPM).
1460
Changeup
Total Movement Avg
The average total non-gravity movement for all pitches of this type in the given event year. Measured in inches (in).
Slider
Velocity Avg
The average velocity for all pitches of this type in the given event year. Measured in miles per hour (MPH).
77.0
Slider
Spin Rate Avg
The average rate of spin for all pitches of this type in the given event year. Measured in rotations per minute (RPM).
2310
Slider
Total Movement Avg
The average total non-gravity movement for all pitches of this type in the given event year. Measured in inches (in).
Fastball
Velocity Max
The maximum observed fastball velocity in the given event year. Measured in miles per hour (MPH).
92.6
Fastball
Velocity Avg
The average velocity for all pitches of this type in the given event year. Measured in miles per hour (MPH).
91.3
Fastball
Spin Rate Avg
The average rate of spin for all pitches of this type in the given event year. Measured in rotations per minute (RPM).
2081
Fastball
Spin Score Avg
The average Bauer Units value of all fastballs in the given event year. Bauer Units are calculated for each pitch by dividing Spin Rate by Velocity.
22.8
Fastball
Total Movement Avg
The average total non-gravity movement for all pitches of this type in the given event year. Measured in inches (in).
Curveball
Velocity Avg
The average velocity for all pitches of this type in the given event year. Measured in miles per hour (MPH).
69.5
Curveball
Spin Rate Avg
The average rate of spin for all pitches of this type in the given event year. Measured in rotations per minute (RPM).
2012
Curveball
Total Movement Avg
The average total non-gravity movement for all pitches of this type in the given event year. Measured in inches (in).
Changeup
Velocity Avg
The average velocity for all pitches of this type in the given event year. Measured in miles per hour (MPH).
75.8
Changeup
Spin Rate Avg
The average rate of spin for all pitches of this type in the given event year. Measured in rotations per minute (RPM).
1530
Changeup
Total Movement Avg
The average total non-gravity movement for all pitches of this type in the given event year. Measured in inches (in).
PBR IL: Heartland CC Scout Day
Sep 15, 2022
Trackman - Fastball
96.8
Velocity (max)
93.1 - 96.6
Velo Range
95.0
Eff Velocity (avg)
2,157
Spin Rate (max)
1,970
Spin Rate (avg)
IVB (max)
IVB (avg)
HM (max)
HM (avg)
Extension (avg)
Release Ht (avg)
Spin Score (max)
Zone %
Trackman - Slider
81.2
Velocity (max)
73.6 - 80.4
Velo Range
76.5
Eff Velocity (avg)
2,388
Spin Rate (max)
2,310
Spin Rate (avg)
IVB (max)
IVB (avg)
HM (max)
HM (avg)
Extension (avg)
Release Ht (avg)
Spin Score (max)
Zone %
Trackman - ChangeUp
82.8
Velocity (max)
78.4 - 81.5
Velo Range
78.8
Eff Velocity (avg)
1,721
Spin Rate (max)
1,460
Spin Rate (avg)
IVB (max)
IVB (avg)
HM (max)
HM (avg)
Extension (avg)
Release Ht (avg)
Spin Score (max)
Zone %
Super 60 Pro Showcase
Feb 2, 2020
Trackman - Fastball
92.6
Velocity (max)
89.8 - 92.6
Velo Range
91.2
Eff Velocity (avg)
2,255
Spin Rate (max)
2,081
Spin Rate (avg)
IVB (max)
IVB (avg)
HM (max)
HM (avg)
Extension (avg)
Release Ht (avg)
Spin Score (max)
Trackman - Curveball
71.3
Velocity (max)
68.3 - 70.8
Velo Range
68.0
Eff Velocity (avg)
2,051
Spin Rate (max)
2,012
Spin Rate (avg)
IVB (max)
IVB (avg)
HM (max)
HM (avg)
Extension (avg)
Release Ht (avg)
Spin Score (max)
Zone %
Trackman - ChangeUp
79.3
Velocity (max)
73.7 - 77.9
Velo Range
75.4
Eff Velocity (avg)
1,625
Spin Rate (max)
1,530
Spin Rate (avg)
IVB (max)
IVB (avg)
HM (max)
HM (avg)
Extension (avg)
Release Ht (avg)
Spin Score (max)
Zone %
Pitch Scores
2022
2020
Fastball
Hop+
A fastball with hop has a flat approach angle and visually jumps through the zone. When thrown up in the zone, it is more likely to generate a higher swing and miss average. Hop+ of 100 is MLB average.
Fastball
Sink+
A fastball with sink has low backspin and drops through the strike zone. When thrown down in the zone, it is more likely to generate a higher ground ball percentage and lower launch angle. Sink+ of 100 is MLB average.
Fastball
Rise+
A fastball with rise has a high percentage of backspin. When thrown up in the zone, it is more likely to generate a higher fly ball percentage. Rise+ of 100 is MLB average
Slider
Hammer+
A hammer breaking ball drops vertically with velocity through the zone, or 12-to-6 movement. Hammer+ of 100 is MLB average.
Slider
Sweep+
A sweeping breaking ball moves horizontally with velocity through the zone. Sweep+ of 100 is MLB average.
Fastball
Hop+
A fastball with hop has a flat approach angle and visually jumps through the zone. When thrown up in the zone, it is more likely to generate a higher swing and miss average. Hop+ of 100 is MLB average.
Fastball
Sink+
A fastball with sink has low backspin and drops through the strike zone. When thrown down in the zone, it is more likely to generate a higher ground ball percentage and lower launch angle. Sink+ of 100 is MLB average.
Fastball
Rise+
A fastball with rise has a high percentage of backspin. When thrown up in the zone, it is more likely to generate a higher fly ball percentage. Rise+ of 100 is MLB average
Curveball
Hammer+
A hammer breaking ball drops vertically with velocity through the zone, or 12-to-6 movement. Hammer+ of 100 is MLB average.
Curveball
Sweep+
A sweeping breaking ball moves horizontally with velocity through the zone. Sweep+ of 100 is MLB average.
Pitching Velos
2022
2020
2019
Fastball
Velocity Max
The maximum observed fastball velocity in the given event year. Measured in miles per hour (MPH).
97.0
Fastball
Velocity Avg
The average velocity for all pitches of this type in the given event year. Measured in miles per hour (MPH)
95.0
Changeup
Velocity Avg
The average velocity for all pitches of this type in the given event year. Measured in miles per hour (MPH)
80.0
Slider
Velocity Avg
The average velocity for all pitches of this type in the given event year. Measured in miles per hour (MPH)
77.0
Fastball
Velocity Max
The maximum observed fastball velocity in the given event year. Measured in miles per hour (MPH).
93.0
Fastball
Velocity Avg
The average velocity for all pitches of this type in the given event year. Measured in miles per hour (MPH)
91.5
Curveball
Velocity Avg
The average velocity for all pitches of this type in the given event year. Measured in miles per hour (MPH)
70.0
Changeup
Velocity Avg
The average velocity for all pitches of this type in the given event year. Measured in miles per hour (MPH)
76.5
Fastball
Velocity Max
The maximum observed fastball velocity in the given event year. Measured in miles per hour (MPH).
94.0
Fastball
Velocity Avg
The average velocity for all pitches of this type in the given event year. Measured in miles per hour (MPH)
89.0
Curveball
Velocity Avg
The average velocity for all pitches of this type in the given event year. Measured in miles per hour (MPH)
64.8
Changeup
Velocity Avg
The average velocity for all pitches of this type in the given event year. Measured in miles per hour (MPH)
74.2
Game Performance


Vizual Edge

Pitch Ai

2022
Arm Speed
The maximum speed, in the direction of home plate, that the wrist is traveling. Measured in meters per second (m/s)
Arm Slot
Angle of the forearm relative to the ground between maximum external rotation (MER) and ball release (BR). Which can be a powerful player comparison metric, delivered in degrees.
Knee Extension Velo
The angular velocity of the front knee straightening after foot plant, which provides indicators of velocity potential. Measured in degrees per second.
Deception
The amount of time that the ball is visible to the hitter, after the instant of front foot strike. Measures in milliseconds.
Hip-Shoulder Separation
The difference in angle of between the hips and shoulders, occurring close to the foot plant. Measured in degrees.
PBR IL: Heartland CC Scout Day
Sep 15, 2022
ProPlayAI - Foot Plant
Elbow Flexion (avg)
Shoulder Abduction (avg)
Hip Shoulder Seperation (avg)
ProPlayAI - MER
External Rotation (avg)
Stride Length (avg)
Horizontal Abduction (avg)
ProPlayAI - Release
Arm Speed (max)
Arm Speed (avg)
Knee Extension Velocity (max)
Knee Extension Velocity (avg)
Knee Flexion (avg)
Arm Slot (avg)
Lateral Trunk Tilt (avg)
Arm Path (avg)
Deception (avg)
Torque (avg)
Efficiency (avg)
Sequencing (avg)
Notes
News
- PBR JUCO: Midseason Top 60 Prospects - Apr 11, 2023
- PBR JUCO: The Buzz (March 14) - Feb 14, 2023
- PBR JUCO: Top 150 Prospects - Jan 2, 2023
- PBR IL: Heartland CC Scout Day: Data Dive - Sep 19, 2022
- PBR IL: Heartland CC Scout Day: Takeaways - Sep 19, 2022
- Puma Classic 2022: Quick Hits- Pitchers - Sep 13, 2022
- Illinois 2020 Rankings Updated - Mar 9, 2020
- Super 60: Trackman Leaderboard - Feb 6, 2020
- Super 60: Illinois Recap - Feb 4, 2020
- Super 60 Spotlight: Isaiah Jackson - Jan 25, 2020
- Illinois 2020 Rankings Updated - Nov 6, 2019
- 2020s On The Rise - Aug 21, 2019
- PBR ProCase - Midwest: Player Analysis - Aug 14, 2019
- Illinois 2020 Rankings Updated - Aug 13, 2019
- Midwest ProCase: Statistical Analysis - Jul 11, 2019
- Midwest ProCase: Quick Hits - Jul 10, 2019
- Inside the Illinois 2020 Rankings: Risers - Apr 9, 2019
- Illinois Metro East Kickoff Classic: Scout Blog - Mar 18, 2019
- IL Preseason All-State: Top Overall Prospects - Mar 8, 2019
- Preseason All-State: Pitcher Analysis - Mar 7, 2019
- Preseason All-State: Outfielder Analysis - Mar 6, 2019
- Preseason All-State: Quick Hits - Feb 11, 2019
- 2018 Future Games: Day 1 Workouts - Aug 9, 2018
- The Rode Show: 2018 Future Games Day 1 - Aug 2, 2018
- PBR Future Games: Illinois Workout Day - Aug 1, 2018
- Future Games Preview: Team Illinois Position Players - Jul 31, 2017
- Preseason Power 25 Countdown: No. 25 Champaign Centennial - Mar 2, 2017
Comments
Draft Reports
Contact
Premium Content Area
To unlock contact information, you need to purchase a ScoutPLUS subscription.
Purchase Subscription OR
Login









 Sign in to view rankings
FB 88-94 with plus movement. CB 72 with big horizontal break.
Redshirt-Freshman. Formerly ranked No. 8 in the Illinois 2020 class. Now healthy, Jackson cleaned up his delivery and is now throwing easy cheese. Showed more effort on this look at scout day than he did at the Puma Classic last week where he played catch at 93-94 mph and touched 98 mph. Not just a raw-armed thrower, in-game he showed an ability to pitch, pulling the string on a 78 mph changeup, then elevating a 94 heater for a strikeout. Followed it up with the next batter with a 75 mph breaker, then painted 95 on the outer black for another strikeout. His bullpen from the scout day was also eye-opening, reaching up to 96.8 mph with the fastball and pairing it most effectively with a slider up to 81 mph (T2,388 RPM). He’s a top-five round MLB Draft follow for 2023 who will need to remain healthy and show consistency in his performance.
2022 Puma Classic: Now healthy, Jackson cleaned up his delivery and is now throwing bullets. Played easy catch at 93-94, touched 98. Not just a raw-armed thrower, he showed some pitch ability in his second frame pulling the string on a 78 mph changeup, then elevating a 94 heater for a strikeout. Followed it up with the next batter with 75 mph breaker, then painting 95 on the outer black for another strikeout. Top 5 round draft follow.
Verbally committed to John A. Logan JC.
Positional Profile: OF/RHP High ceiling two-way prospect.
Body: 6-foot-5, 185-pounds. Highly projectable frame, long twitchy levers, slender build with room to fill.
Defense: Long levers plays through the baseball, shuffles through release.
Arm: RH. OF - 93 mph. Long loose arm action, over the top slot, carries out of the hand.
Hit: RHH. Tall setup, balanced stance, short lift and replace stride, smooth loading action. Long levers, creates lift, loose hands above average bat speed with gap to gap approach.
Power: 94 mph exit velocity from the tee. Power potential bat.
Run: 6.78 runner in the 60. Long strider, low effort.
Delivery: Down tempo delivery, lands square, recoil finish.
Arm Action: RH. Electric arm, loose and quick out of high 3/4 slot.
FB: T94, 86-92 mph. Life through the zone, erratic life creates uncomfortable at bat.
CB: 65-69 mph. 10/4 shape.
CH: 77-79 mph. Slight arm decel.
6-foot-5, 185-pound, right-handed hitting/throwing two-way player, high-waisted upside frame, oozes athleticism. On the mound, works with tempo, hip leads down the mound, foot strikes in-line and heel first, pop up finish, smooth rhythm. Short, loose arm action, quick out front, high ¾ slot. Electric arm speed on fastball, flashed late run and tilt, 86-92 mph, topped 93 mph. Curveball, 11/5 shape, slows arm, 59-66 mph. Changeup slight fade, some arm speed, 69-72 mph. Gets to max speed easily, long strides, 6.63 60-yard dash. Defensively plays through the ball, clean exchange, pats glove. Arm is loose and quick, high ¾ slot, ball comes out firm, throws carried 92 mph from the outfield. At the plate, open, tall setup, slight wrap load, long stride. Looseness in hands, uphill path, rhythm involved, exit velocity topped 95 mph from a tee.