CLASS OF 2020
OF
SS
Tre
Hondras
John A. Logan JC
Homewood-Flossmoor (HS) • IL
6' 0" • 190LBS
R/R • 24yr 1mo
Travel Team: White Sox ACE
Homewood-Flossmoor (HS) • IL
6' 0" • 190LBS
R/R • 24yr 1mo
Travel Team: White Sox ACE
Rankings
2020 National
Rankings available to Premium Subscriber
2020 State
Rankings available to Premium Subscriber
Commitment
Best Of Stats
24.5
Hand Speed (max)
10/07/21
76.6
Bat Speed (max)
10/07/21
22.6
Rot. Acc (max)
10/07/21
78
Hard Hit %
10/05/22
101.1
Exit Velocity (max)
2/02/20
92.9
Exit Velocity (avg)
10/05/22
370
Distance (max)
2/02/20
72
Sweet Spot %
10/05/22
6.60
60-yd
2/10/19
3.82
30-yd
10/05/22
1.69
10-yd
10/05/22
21.0
Run speed (max)
10/05/22
86
INF Velo
2/02/20
87
OF Velo
2/02/20
-
C Velo
-
Pop Time
Positional Tools
2022
2021
2020
2019
2018
2017
60 Yard Dash
The athlete's fastest 60-yard dash time in the given event year. Measured in seconds (s)
6.74
Infield Velocity
The athlete's maximum throwing velocity from an infield position in the given event year. Measured in miles per hour (MPH).
84.0
Outfield Velocity
The athlete's maximum throwing velocity from an outfield position in the given event year. Measured in miles per hour (MPH).
86.0
Power / Speed Score
A simple calculation that divides the athlete’s Exit Velocity Max by the athlete’s 60 Yard Dash time for the given event year. For example, 98 MPH / 7.00s = 14.00.
14.8
60 Yard Dash
The athlete's fastest 60-yard dash time in the given event year. Measured in seconds (s)
6.65
Infield Velocity
The athlete's maximum throwing velocity from an infield position in the given event year. Measured in miles per hour (MPH).
84.0
Outfield Velocity
The athlete's maximum throwing velocity from an outfield position in the given event year. Measured in miles per hour (MPH).
84.0
Power / Speed Score
A simple calculation that divides the athlete’s Exit Velocity Max by the athlete’s 60 Yard Dash time for the given event year. For example, 98 MPH / 7.00s = 14.00.
14.3
Infield Velocity
The athlete's maximum throwing velocity from an infield position in the given event year. Measured in miles per hour (MPH).
86.0
Outfield Velocity
The athlete's maximum throwing velocity from an outfield position in the given event year. Measured in miles per hour (MPH).
87.0
60 Yard Dash
The athlete's fastest 60-yard dash time in the given event year. Measured in seconds (s)
6.60
Infield Velocity
The athlete's maximum throwing velocity from an infield position in the given event year. Measured in miles per hour (MPH).
84.0
Outfield Velocity
The athlete's maximum throwing velocity from an outfield position in the given event year. Measured in miles per hour (MPH).
86.0
Power / Speed Score
A simple calculation that divides the athlete’s Exit Velocity Max by the athlete’s 60 Yard Dash time for the given event year. For example, 98 MPH / 7.00s = 14.00.
14.5
60 Yard Dash
The athlete's fastest 60-yard dash time in the given event year. Measured in seconds (s)
6.92
Infield Velocity
The athlete's maximum throwing velocity from an infield position in the given event year. Measured in miles per hour (MPH).
78.0
Power / Speed Score
A simple calculation that divides the athlete’s Exit Velocity Max by the athlete’s 60 Yard Dash time for the given event year. For example, 98 MPH / 7.00s = 14.00.
13.0
60 Yard Dash
The athlete's fastest 60-yard dash time in the given event year. Measured in seconds (s)
6.80
Infield Velocity
The athlete's maximum throwing velocity from an infield position in the given event year. Measured in miles per hour (MPH).
78.0
Outfield Velocity
The athlete's maximum throwing velocity from an outfield position in the given event year. Measured in miles per hour (MPH).
83.0
Power / Speed Score
A simple calculation that divides the athlete’s Exit Velocity Max by the athlete’s 60 Yard Dash time for the given event year. For example, 98 MPH / 7.00s = 14.00.
13.7
Hitting
2022
2021
2020
Exit Velocity Max
The highest exit velocity of any batted ball in the given event year. Measured in miles per hour (MPH).
99.9
Exit Velocity Avg
Average exit velocity of all batted balls in the given event year. Measured in miles per hour (MPH).
92.9
Distance Max
The highest flight distance of any batted ball in the given event year. Measured in feet (ft).
361
Distance Avg
Average flight distance of all batted balls in the given event year. Measured in feet (ft).
255
Launch Angle Avg
Average launch angle of all batted balls in the given event year. Measured in degrees.
20.3
Hard Hit %
Percentage of batted balls with exit velocities over 95 MPH in the given event year.
Sweet Spot %
Percentage of batted balls in the given event year with a launch angle between 8° and 32°.
Line Drive %
Percentage of batted balls with launch angles between 10 and 25 degrees in the given event year.
Fly Ball %
Percentage of batted balls with launch angles between 25 and 50 degrees in the given event year.
Ground Ball %
Percentage of batted balls with launch angles below 10 degrees in the given event year.
Exit Velocity Max
The highest exit velocity of any batted ball in the given event year. Measured in miles per hour (MPH).
95.2
Exit Velocity Avg
Average exit velocity of all batted balls in the given event year. Measured in miles per hour (MPH).
89.8
Distance Max
The highest flight distance of any batted ball in the given event year. Measured in feet (ft).
353
Distance Avg
Average flight distance of all batted balls in the given event year. Measured in feet (ft).
244
Launch Angle Avg
Average launch angle of all batted balls in the given event year. Measured in degrees.
21.6
Hard Hit %
Percentage of batted balls with exit velocities over 95 MPH in the given event year.
Sweet Spot %
Percentage of batted balls in the given event year with a launch angle between 8° and 32°.
Line Drive %
Percentage of batted balls with launch angles between 10 and 25 degrees in the given event year.
Fly Ball %
Percentage of batted balls with launch angles between 25 and 50 degrees in the given event year.
Ground Ball %
Percentage of batted balls with launch angles below 10 degrees in the given event year.
Exit Velocity Max
The highest exit velocity of any batted ball in the given event year. Measured in miles per hour (MPH).
101.1
Exit Velocity Avg
Average exit velocity of all batted balls in the given event year. Measured in miles per hour (MPH).
85.4
Distance Max
The highest flight distance of any batted ball in the given event year. Measured in feet (ft).
370
Distance Avg
Average flight distance of all batted balls in the given event year. Measured in feet (ft).
278
Launch Angle Avg
Average launch angle of all batted balls in the given event year. Measured in degrees.
31.7
Hard Hit %
Percentage of batted balls with exit velocities over 95 MPH in the given event year.
Sweet Spot %
Percentage of batted balls in the given event year with a launch angle between 8° and 32°.
Line Drive %
Percentage of batted balls with launch angles between 10 and 25 degrees in the given event year.
Fly Ball %
Percentage of batted balls with launch angles between 25 and 50 degrees in the given event year.
Ground Ball %
Percentage of batted balls with launch angles below 10 degrees in the given event year.
PBR IL: John A Logan / SIC / Rend Lake / Kaskaskia Scout Day
Oct 5, 2022
Trackman - Hitting
99.9
Exit Velocity (max)
92.9
Exit Velocity (avg)
255
Distance (avg)
361
Distance (max)
Hard Hit %
Barrel %
Sweet Spot %
Line Drive %
Fly Ball %
Ground Ball %
PBR IL: John A. Logan JC Scout Day
Oct 7, 2021
Trackman - Hitting
95.2
Exit Velocity (max)
89.8
Exit Velocity (avg)
244
Distance (avg)
353
Distance (max)
Hard Hit %
Sweet Spot %
Line Drive %
Fly Ball %
Ground Ball %
Super 60 Pro Showcase
Feb 2, 2020
Trackman - Hitting
101.1
Exit Velocity (max)
85.4
Exit Velocity (avg)
278
Distance (avg)
370
Distance (max)
Hard Hit %
Sweet Spot %
Line Drive %
Fly Ball %
Ground Ball %
Hitting
2022
2021
Hand Speed Max
The highest Peak Hand Speed of any swing in the given event year.
22.6
Hand Speed Avg
The average Peak Hand Speed for all swings in the given event year.
20.9
Bat Speed Max
The highest Bat Speed of any swing in the given event year.
74.4
Bat Speed Avg
The average Bat Speed for all swings in the given event year.
69.2
Rotational Acceleration Max
The highest Rotational Acceleration of any swing in the given event year.
Rotational Acceleration Avg
The average Rotational Acceleration for all swings in the given event year.
On-Plane Efficiency Max
The highest On-Plane Efficiency of any swing in the given event year.
On-Plane Efficiency Avg
The average On-Plane Efficiency for all swings in the given event year.
Hand Speed Max
The highest Peak Hand Speed of any swing in the given event year.
24.5
Hand Speed Avg
The average Peak Hand Speed for all swings in the given event year.
23.0
Bat Speed Max
The highest Bat Speed of any swing in the given event year.
76.6
Bat Speed Avg
The average Bat Speed for all swings in the given event year.
73.6
Rotational Acceleration Max
The highest Rotational Acceleration of any swing in the given event year.
Rotational Acceleration Avg
The average Rotational Acceleration for all swings in the given event year.
On-Plane Efficiency Max
The highest On-Plane Efficiency of any swing in the given event year.
On-Plane Efficiency Avg
The average On-Plane Efficiency for all swings in the given event year.
PBR IL: John A Logan / SIC / Rend Lake / Kaskaskia Scout Day
Oct 5, 2022
Blast - Hitting
22.6
Hand Speed (max)
20.9
Hand Speed (avg)
74.4
Bat Speed (max)
69.2
Bat Speed (avg)
Rot. Acc (max)
Rot. Acc (avg)
On Plane Eff (avg)
MaxOnPlaneEfficiency
PBR IL: John A. Logan JC Scout Day
Oct 7, 2021
Blast - Hitting
24.5
Hand Speed (max)
23.0
Hand Speed (avg)
76.6
Bat Speed (max)
73.6
Bat Speed (avg)
Rot. Acc (max)
Rot. Acc (avg)
On Plane Eff (avg)
Pitching
Pitch Scores
Pitching Velos
Game Performance
2022
10 Yard Dash
The athlete's fastest 0-10-yard split time in the given event year. Measured in seconds.
1.69
30 Yard Dash
The athlete's fastest 0-30-yard split time in the given event year. Measured in seconds.
3.82
60 Yard Dash
The athlete's fastest 0-60-yard time in the given event year. Measured in seconds.
6.74
Top Speed (MPH)
The athlete's fastest split time converted to miles per hour.
Vizual Edge
Pitch Ai
Notes
News
- PBR IL: John A. Logan / SIC / Rend Lake / Kaskaskia: Data Dive - Oct 11, 2022
- PBR IL: John A. Logan / SIC / Rend Lake / Kaskaskia: Takeaways - Oct 10, 2022
- Puma Classic 2022: Quick Hits- Position Players - Sep 12, 2022
- Best of 2021: JUCO 60-Yard Dash Leaders - Dec 9, 2021
- PBR IL - John A Logan JC Scout Day: Takeaways - Oct 20, 2021
- PBR IL - John A. Logan Scout Day: Statistical Analysis - Oct 12, 2021
- Illinois 2020 Rankings Updated - Mar 9, 2020
- Super 60: Blast Leaderboard - Feb 7, 2020
- Super 60: Illinois Recap - Feb 4, 2020
- Super 60 Spotlight: Tre Hondras - Jan 29, 2020
- PBR ProCase - Midwest: Player Analysis - Aug 14, 2019
- Midwest ProCase: Quick Hits - Jul 10, 2019
- No. 3 Lincoln-Way East plates eight late, wins SWSC opener - Apr 9, 2019
- Week 4 Games - Apr 8, 2019
- Schlaffer, No. 25 Homewood-Flossmoor Rout Andrew - Apr 5, 2019
- A Three-Run First Propels No. 2 Brother Rice Over No. 13 Homewood-Flossmoor - Mar 23, 2019
- Preseason Power 25 Countdown: No. 13 Homewood-Flossmoor - Mar 8, 2019
- IL Preseason All-State: Top Overall Prospects - Mar 8, 2019
- Preseason All-State: Infielder Analysis - Mar 7, 2019
- Preseason All-State: Outfielder Analysis - Mar 6, 2019
- Preseason All-State: Quick Hits - Feb 11, 2019
- Inside The Illinois Rankings: 2020 Risers - Aug 29, 2018
- Team Illinois Quick Hits - Aug 6, 2018
- PBR Future Games: Illinois Workout Day - Aug 1, 2018
- Day 3: Oklahoma Limited Series - Jul 30, 2018
- 4A New Lenox Regional: Providence Handles Homewood-Flossmoor - May 24, 2018
- Walker's Week Off to Hot Start, Homewood-Flossmoor tops Lockport - May 1, 2018
- Walker, Schroeder, Homewood-Flossmoor Power Past Simeon - Apr 24, 2018
- Preseason Power 25: Bubble Teams - Mar 20, 2018
- Underclass Invitational: Infielder Analysis - Mar 7, 2018
- Underclass Invitational: Preview - Feb 14, 2018
- Illinois Underclass Showcase: Top Overall Prospects - Nov 17, 2017
- Underclass Showcase: Infield Analysis - Nov 15, 2017
- Underclass Showcase: Outfield Analysis - Nov 14, 2017
- Underclass Showcase: Statistical Analysis - Oct 24, 2017
- Underclass Showcase: Quick Hits - Oct 23, 2017
- Underclass Showcase: Preview - Oct 18, 2017
- Preseason Power 25 Countdown: No. 21 Homewood-Flossmoor - Mar 3, 2017
- Underclass Invitational: Top Overall Prospects - Jan 27, 2017
- Underclass Invitational: Infield Analysis - Jan 25, 2017
- Underclass Invitational: Outfield Analysis - Jan 24, 2017
- Underclass Invitational Preview: Roster and Check-In Times - Jan 11, 2017
Comments
Draft Reports
Contact
Premium Content Area
To unlock contact information, you need to purchase a ScoutPLUS subscription.
Purchase Subscription OR
Login

Sign in to view rankings
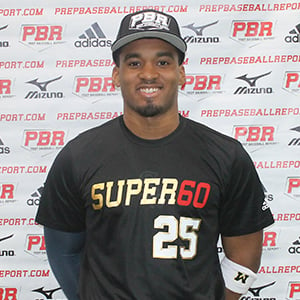
Redshirt-sophomore. 6-foot, 190-pound build, lean/athletic frame. Hondras started his day by running to a 6.74 60-yard dash, however we’ve seen him down to 6.60 in year’s past. The right-handed hitter has an unorthodox operation but makes it work thanks to his athleticism. He worked hard off the barrel to his pull-side with hand speed and athletic wrists, averaging 92.9 mph throughout his round with a max exit velocity of 100 mph (361’ max distance). He is an athletic defender in the outfield, moving with intent and fluid footwork to the ball with reliable hands, reaching up to 85 mph from a crow-hop.
Transferring from College of Central Florida to John A. Logan JC. Former Super 60 participant, ranked No. 10 in the Illinois' 2020 class, No. 393 overall.
Positional Profile: OF/SS
Body: 6-foot-0, 180-pounds. Athletic build with strength.
Defense: Actions play through the baseball, showed athletic actions both on the infield and outfield.
Arm: RH. INF - 78 mph. OF - 83 mph. Short over the top arm action, played online, athletic arm action.
Hit: RHH. Balanced stance, quiet pre pitch, smooth loading action, good balance through contact, simple and easy in the box. Loose hands, gap to gap approach, hits in rhythm and gets easy hard contact off the bat, path stays on top, creates backspin.
Power: 96 mph exit velocity from the tee. Above average power, hard contact off the bat.
Run: 6.84 runner in the 60.
Michigan commit, currently ranked No. 13 in the Illinois’ 2020 class. 6-foot, 180-pound, athletically-built, right-handed hitting, center fielder. Plays the game with enthusiasm, extreme aggressiveness, hard out of the box and always looking to take the extra base. Took competitive at-bats swings throughout the game. Every ball put into play was hit on the barrel. Finished 2-for-4 with two runs scored, an RBI, walk, stolen base and reached base safely in all five at-bats. Singled hard into left-field twice, 4.68 and 4.61 on the turn. Reached on an infield error, 4.35 down the line. Natural in center field, did not see much action. High-level 2020 prospect.
2/10/19 - Michigan commit. 6-foot, 180-pound, right-handed hitting/throwing multi-positional player, advanced athletic frame. Has made major strides in his 60 time in the past year, ran a quick 6.60. Offensively, wide, balanced setup, smooth load, short stride, maintains control. Swing has polish, fluidity in hands, path is short and direct, barreled up the baseballs to all fields. Fast bat speed, exit velocity topped 91 mph from a tee. Natural actions at both positions, ranges all directions, soft, sure hands, quick and clean transfer to release, seems easy. Short, clean high ¾ slot, can drop slot, throws carried 86 mph from the outfield and 84 mph across the diamond. High-level 2020 prospect.
7.30.18 - On Day 3 at OK Limited Series, Hondras’ quick hands stood out all game with near-electric bat speed through the zone. His hands start high with little movement pre-pitch before a late crouch into a power-position with a short stride and hitch works his hands down through the zone with a high finish. Hondras took a number of quality swings, and was rewarded with a hard-hit single in his first at-bat. He also roams centerfield well, and has clean ball skills.
2.18.18 - 6-foot, 180-pound, infielder with a mature, athletic frame. 6.92 runner in the 60, laser-timed. Right-handed hitter, presence in the box, balanced setup, smooth load and short stride. Quick, athletic hands, creates bat speed, hard contact to both gaps and fluid rhythm throughout. 90 mph exit velocity from a tee. Defensively, fluid footwork, ranges well to both sides and plays under control. Sure hands, works through the baseball and directional to target. Short, over-the-top arm action, throws clocked at 78 mph.
10.22.17 - Highly athletic 6-foot, 175-pound right-handed hitting 2B/OF. Ran an event best 6.80 60-yard dash. At the plate hits from a crouched, open setup, short stride with good balance. Gap to gap hitter with fluid rhythm and a fast bat. Short, uphill swing path. 93 mph exit velocity from a tee with wood. Defensively took drills in the both the infield and outfield. In the infield, fluid footwork with athletic actions and soft hands. Long arm action from a high ¾ slot. Threw 78 mph across the infield. In the outfield plays thru the ball with solid footwork and hands, threw 83 mph.
4.25.17 - 6-foot, 160-pound, well-proportioned, right-handed hitting first baseman. Will continue to get bigger and add quality strength. Offensively, good approach for his age. Even, slightly crouched setup, minimal load, head stays still and his hands stay back. Made adjustments at the plate throughout. Defensively, played first base on the day, moves well and would like to see in the outfield. High-follow 2020 prospect.
1.15.17 - 6-foot, 160-pound right-handed hitting 2B/OF with an athletic frame. At the plate hits from a balanced setup with a smooth load and short stride. Gap to gap hitter with fluid rhythm and good balance. Showed strength thru contact with 87 mph exit velocity from a tee. Ran the 60 at 7.11. Defensively in the outfield has a long arm action from a high ¾ slot. Plays thru the ball with a clean exchange. Throws showed carry throwing 81 mph from the outfield. In the infield has solid actions with fluid footwork and soft hands. Threw 70 mph across the diamond.