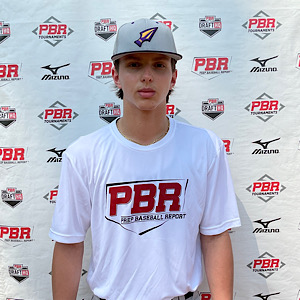
CLASS OF 2026
RHP
Jackson
Stahl
Hononegah (HS) • IL
 6' 2" • 183.9LBS
R/R • 17yr 11mo
Travel Team: GRB Madison 17u Green
R/R • 17yr 11mo
Travel Team: GRB Madison 17u Green
Rankings
2026 National
Rankings available to Premium Subscriber
2026 State
Rankings available to Premium Subscriber
Commitment
Best Of Stats
Fastball
88.5
Velocity (max)
8/05/25
85 - 88
Velo Range
8/05/25
2239
Spin Rate (avg)
7/11/23
Changeup
71.7 - 74.4
Velo Range
2/26/23
1905
Spin Rate (avg)
8/08/23
Curveball
71.7 - 73.2
Velo Range
8/08/23
2256
Spin Rate (avg)
7/11/23
Slider
74 - 78
Velo Range
8/05/25
2277
Spin Rate (avg)
8/05/25
Positional Tools
Hitting

Hitting

Pitching

2025
2023
Fastball
Velocity Max
The maximum observed fastball velocity in the given event year. Measured in miles per hour (MPH).
88.5
Fastball
Velocity Avg
The average velocity for all pitches of this type in the given event year. Measured in miles per hour (MPH).
86.3
Fastball
Spin Rate Avg
The average rate of spin for all pitches of this type in the given event year. Measured in rotations per minute (RPM).
2143
Fastball
Spin Score Avg
The average Bauer Units value of all fastballs in the given event year. Bauer Units are calculated for each pitch by dividing Spin Rate by Velocity.
24.8
Fastball
Total Movement Avg
The average total non-gravity movement for all pitches of this type in the given event year. Measured in inches (in).
Slider
Velocity Avg
The average velocity for all pitches of this type in the given event year. Measured in miles per hour (MPH).
75.9
Slider
Spin Rate Avg
The average rate of spin for all pitches of this type in the given event year. Measured in rotations per minute (RPM).
2277
Slider
Total Movement Avg
The average total non-gravity movement for all pitches of this type in the given event year. Measured in inches (in).
Cutter
Velocity Avg
The average velocity for all pitches of this type in the given event year. Measured in miles per hour (MPH).
78.6
Cutter
Spin Rate Avg
The average rate of spin for all pitches of this type in the given event year. Measured in rotations per minute (RPM).
2180
Cutter
Total Movement Avg
The average total non-gravity movement for all pitches of this type in the given event year. Measured in inches (in).
Fastball
Velocity Max
The maximum observed fastball velocity in the given event year. Measured in miles per hour (MPH).
84.3
Fastball
Velocity Avg
The average velocity for all pitches of this type in the given event year. Measured in miles per hour (MPH).
81.9
Fastball
Spin Rate Avg
The average rate of spin for all pitches of this type in the given event year. Measured in rotations per minute (RPM).
2078
Fastball
Spin Score Avg
The average Bauer Units value of all fastballs in the given event year. Bauer Units are calculated for each pitch by dividing Spin Rate by Velocity.
25.4
Fastball
Total Movement Avg
The average total non-gravity movement for all pitches of this type in the given event year. Measured in inches (in).
Curveball
Velocity Avg
The average velocity for all pitches of this type in the given event year. Measured in miles per hour (MPH).
72.1
Curveball
Spin Rate Avg
The average rate of spin for all pitches of this type in the given event year. Measured in rotations per minute (RPM).
2200
Curveball
Total Movement Avg
The average total non-gravity movement for all pitches of this type in the given event year. Measured in inches (in).
Changeup
Velocity Avg
The average velocity for all pitches of this type in the given event year. Measured in miles per hour (MPH).
73.3
Changeup
Spin Rate Avg
The average rate of spin for all pitches of this type in the given event year. Measured in rotations per minute (RPM).
1637
Changeup
Total Movement Avg
The average total non-gravity movement for all pitches of this type in the given event year. Measured in inches (in).
Cutter
Velocity Avg
The average velocity for all pitches of this type in the given event year. Measured in miles per hour (MPH).
73.5
Cutter
Spin Rate Avg
The average rate of spin for all pitches of this type in the given event year. Measured in rotations per minute (RPM).
2060
Cutter
Total Movement Avg
The average total non-gravity movement for all pitches of this type in the given event year. Measured in inches (in).
Illinois State Games (Invite-Only)
Aug 5, 2025
Trackman - Fastball
88.5
Velocity (max)
84.7 - 87.9
Velo Range
85.7
Eff Velocity (avg)
2,285
Spin Rate (max)
2,143
Spin Rate (avg)
IVB (max)
IVB (avg)
HM (max)
HM (avg)
Extension (avg)
Release Ht (avg)
Spin Score (max)
Zone %
Spin Efficiency % (avg)
Trackman - Slider
78.3
Velocity (max)
74.0 - 77.8
Velo Range
74.5
Eff Velocity (avg)
2,363
Spin Rate (max)
2,277
Spin Rate (avg)
IVB (max)
IVB (avg)
HM (max)
HM (avg)
Extension (avg)
Release Ht (avg)
Spin Score (max)
Zone %
Spin Efficiency % (avg)
Trackman - Cutter
79.5
Velocity (max)
77.7 - 79.5
Velo Range
77.0
Eff Velocity (avg)
2,360
Spin Rate (max)
2,180
Spin Rate (avg)
IVB (max)
IVB (avg)
HM (max)
HM (avg)
Extension (avg)
Release Ht (avg)
Spin Score (max)
Zone %
Spin Efficiency % (avg)
Illinois State Games (Invite-Only)
Aug 8, 2023
Trackman - Fastball
84.3
Velocity (max)
80.9 - 84.0
Velo Range
81.2
Eff Velocity (avg)
2,061
Spin Rate (max)
1,999
Spin Rate (avg)
IVB (max)
IVB (avg)
HM (max)
HM (avg)
Extension (avg)
Release Ht (avg)
Spin Score (max)
Zone %
Spin Efficiency % (avg)
Trackman - Curveball
73.4
Velocity (max)
71.7 - 73.2
Velo Range
70.5
Eff Velocity (avg)
2,280
Spin Rate (max)
2,190
Spin Rate (avg)
IVB (max)
IVB (avg)
HM (max)
HM (avg)
Extension (avg)
Release Ht (avg)
Spin Score (max)
Zone %
Spin Efficiency % (avg)
Trackman - ChangeUp
74.3
Velocity (max)
73.3 - 74.3
Velo Range
72.0
Eff Velocity (avg)
2,155
Spin Rate (max)
1,905
Spin Rate (avg)
IVB (max)
IVB (avg)
HM (max)
HM (avg)
Extension (avg)
Release Ht (avg)
Spin Score (max)
Zone %
Spin Efficiency % (avg)
Northwest Suburban Open
Jul 11, 2023
Trackman - Fastball
83.9
Velocity (max)
81.6 - 83.6
Velo Range
81.4
Eff Velocity (avg)
2,315
Spin Rate (max)
2,239
Spin Rate (avg)
IVB (max)
IVB (avg)
HM (max)
HM (avg)
Extension (avg)
Release Ht (avg)
Spin Score (max)
Zone %
Spin Efficiency % (avg)
Trackman - Curveball
72.4
Velocity (max)
71.5 - 72.4
Velo Range
71.1
Eff Velocity (avg)
2,336
Spin Rate (max)
2,256
Spin Rate (avg)
IVB (max)
IVB (avg)
HM (max)
HM (avg)
Extension (avg)
Release Ht (avg)
Spin Score (max)
Spin Efficiency % (avg)
Trackman - ChangeUp
74.0
Velocity (max)
72.5 - 73.8
Velo Range
73.0
Eff Velocity (avg)
1,664
Spin Rate (max)
1,540
Spin Rate (avg)
IVB (max)
IVB (avg)
HM (max)
HM (avg)
Extension (avg)
Release Ht (avg)
Spin Score (max)
Zone %
Spin Efficiency % (avg)
Trackman - Cutter
74.5
Velocity (max)
72.5 - 74.5
Velo Range
71.6
Eff Velocity (avg)
2,235
Spin Rate (max)
2,179
Spin Rate (avg)
IVB (max)
IVB (avg)
HM (max)
HM (avg)
Extension (avg)
Release Ht (avg)
Spin Score (max)
Spin Efficiency % (avg)
Joliet Preseason ID
Feb 26, 2023
Trackman - Fastball
81.7
Velocity (max)
79.7 - 81.6
Velo Range
80.0
Eff Velocity (avg)
2,149
Spin Rate (max)
2,011
Spin Rate (avg)
IVB (max)
IVB (avg)
HM (max)
HM (avg)
Extension (avg)
Release Ht (avg)
Spin Score (max)
Zone %
Spin Efficiency % (avg)
Trackman - Curveball
72.9
Velocity (max)
71.1 - 72.8
Velo Range
71.3
Eff Velocity (avg)
2,275
Spin Rate (max)
2,142
Spin Rate (avg)
IVB (max)
IVB (avg)
HM (max)
HM (avg)
Extension (avg)
Release Ht (avg)
Spin Score (max)
Zone %
Spin Efficiency % (avg)
Trackman - ChangeUp
74.4
Velocity (max)
71.7 - 74.4
Velo Range
71.8
Eff Velocity (avg)
1,548
Spin Rate (max)
1,466
Spin Rate (avg)
IVB (max)
IVB (avg)
HM (max)
HM (avg)
Extension (avg)
Release Ht (avg)
Spin Score (max)
Zone %
Spin Efficiency % (avg)
Trackman - Cutter
74.8
Velocity (max)
72.3 - 74.8
Velo Range
72.9
Eff Velocity (avg)
2,077
Spin Rate (max)
2,000
Spin Rate (avg)
IVB (max)
IVB (avg)
HM (max)
HM (avg)
Extension (avg)
Release Ht (avg)
Spin Score (max)
Zone %
Spin Efficiency % (avg)
Pitch Scores
2025
2023
Fastball
Rise+
A fastball with rise has a high percentage of backspin. When thrown up in the zone, it is more likely to generate a higher fly ball percentage. Rise+ of 100 is MLB average
Slider
Hammer+
A hammer breaking ball drops vertically with velocity through the zone, or 12-to-6 movement. Hammer+ of 100 is MLB average.
Slider
Sweep+
A sweeping breaking ball moves horizontally with velocity through the zone. Sweep+ of 100 is MLB average.
Fastball
Hop+
A fastball with hop has a flat approach angle and visually jumps through the zone. When thrown up in the zone, it is more likely to generate a higher swing and miss average. Hop+ of 100 is MLB average.
Fastball
Sink+
A fastball with sink has low backspin and drops through the strike zone. When thrown down in the zone, it is more likely to generate a higher ground ball percentage and lower launch angle. Sink+ of 100 is MLB average.
Fastball
Rise+
A fastball with rise has a high percentage of backspin. When thrown up in the zone, it is more likely to generate a higher fly ball percentage. Rise+ of 100 is MLB average
Curveball
Hammer+
A hammer breaking ball drops vertically with velocity through the zone, or 12-to-6 movement. Hammer+ of 100 is MLB average.
Curveball
Sweep+
A sweeping breaking ball moves horizontally with velocity through the zone. Sweep+ of 100 is MLB average.
Pitching Velos
2025
2023
Fastball
Velocity Max
The maximum observed fastball velocity in the given event year. Measured in miles per hour (MPH).
88.0
Fastball
Velocity Avg
The average velocity for all pitches of this type in the given event year. Measured in miles per hour (MPH)
86.5
Slider
Velocity Avg
The average velocity for all pitches of this type in the given event year. Measured in miles per hour (MPH)
76.0
Fastball
Velocity Max
The maximum observed fastball velocity in the given event year. Measured in miles per hour (MPH).
84.0
Fastball
Velocity Avg
The average velocity for all pitches of this type in the given event year. Measured in miles per hour (MPH)
80.9
Curveball
Velocity Avg
The average velocity for all pitches of this type in the given event year. Measured in miles per hour (MPH)
70.9
Changeup
Velocity Avg
The average velocity for all pitches of this type in the given event year. Measured in miles per hour (MPH)
72.1
Game Performance


Vizual Edge

Pitch Ai

Notes
News
- Class of 2026 Rankings Update - Aug 27, 2025
- Illinois State Games: Teams 1-10 Takeaways - Aug 14, 2025
- Preseason Power 25 Countdown: No. 25 Hononegah - Mar 4, 2024
- Illinois State Games: 2026 Pitcher Analysis - Oct 27, 2023
- Northwest Suburban Open: Pitcher Analysis - Sep 25, 2023
- Illinois State Games: Takeaways, 2026s - Aug 22, 2023
- Joliet Preseason ID: Pitcher Analysis - May 31, 2023
Comments
Draft Reports
Contact
Premium Content Area
To unlock contact information, you need to purchase a ScoutPLUS subscription.
Purchase Subscription OR
Login


 Sign in to view rankings
Stahl, a 6-foot-3, 190-pound right-hander, led the staff in innings pitched as a freshman a season ago; posting a 2.02 ERA in 59 innings to go along with a 9-1 record and 70 strikeouts against only 14 walks. He has shown extremely well in front of our staff, particularly at the Illinois State Games this past summer where he impressed with a fastball in the 80-84 mph range, pairing with an effective curveball/changeup duo to keep hitters off-balance. He has some important innings under his belt already, getting the win in the Regional Championship game last season as well as the Sectional Semi-Final game.
RHP Jackson Stahl (Hononegah, 2026) opened some eyes with his strong showing on Tuesday night. Listed at an athletic 6-foot-2, 180-pounds with room to add on strength. The right-hander has a simple and repeatable delivery with a slight preload in the back leg before stride, works in-line down the mound with easy effort. Stahl worked his fastball in the 80-84 mph range with some finish through the zone and up to 16” of run at times. Showed to have some feel for a downer 11/5 curveball at 71-73 mph, landing it for strikes and also kept mostly down. Flashed a straight changeup at 73-74 mph to finish off his arsenal.
Positional Profile: RHP/OF
Body: 6-2, 180-pounds.
Delivery: Up tempo, medium leg lift with tuck, tall/fall delivery, lands in-line with plate.
Arm Action: RH. Full arm circle, low 3/4 slot.
FB: T84, 81-84 mph. Arm-side-run, firm. T2061, 1999 average rpm.
CB: 72-73 mph. 11/5 break with some depth. T2280, 2190 average rpm.
CH: 73-74 mph. Fade to the arm side, kills spin. T2155, 1905 average rpm.
Positional Profile: RHP/3B
Body: 6-2, 165-pounds. Athletic build, projectable, room to fill.
Delivery: Uptempo, slight drop and drive delivery, works athletic down the mound.
Arm Action: RH. Long arm action, plays strong and firm out of a high 3/4 slot.
FB: T82, 80-82 mph. Flashed life out of the hand, slight arm-side run, around the zone. T2149, 2011 average rpm.
CB: 71-73 mph. Intent, 11/5 shape, flashed depth. T2275, 2142 average rpm.
CH: 72-74 mph. Fastball arm speed, pulls to glove side at times. When at its best, flashed slight fade. T1548, 1466 average rpm.
CUT: 72-75 mph. Plays well off the fastball, thrown with intent, late 10/4 shape.