CLASS OF 2024
LHP
LHP
Max
Kaplan
USC Upstate
New Trier (HS) • IL
6' 1" • 184.3LBS
L/L • 19yr 7mo
Travel Team: Cangelosi Sparks North Black
New Trier (HS) • IL
L/L • 19yr 7mo
Travel Team: Cangelosi Sparks North Black
Rankings
2024 National
Rankings available to Premium Subscriber
2024 State
Rankings available to Premium Subscriber
Commitment
Best Of Stats
Fastball
83.3
Velocity (max)
8/08/23
82 - 83
Velo Range
3/13/23
2036
Spin Rate (avg)
2/12/23
Changeup
73 - 75
Velo Range
3/11/24
1754
Spin Rate (avg)
2/12/23
Curveball
71 - 71
Velo Range
6/23/22
1651
Spin Rate (avg)
3/13/21
Slider
66.2 - 67.3
Velo Range
8/08/23
1909
Spin Rate (avg)
8/08/23
78.2
Exit Velocity (max)
3/13/21
71.6
Exit Velocity (avg)
3/13/21
275
Distance (max)
3/13/21
60
Sweet Spot %
3/13/21
22.2
Hand Speed (max)
3/13/21
63.2
Bat Speed (max)
3/13/21
14.2
Rot. Acc (max)
3/13/21
-
Hard Hit %
7.43
60-yd
2/12/23
4.05
30-yd
2/12/23
1.69
10-yd
2/12/23
18.2
Run speed (max)
2/12/23
75
INF Velo
3/13/21
-
OF Velo
-
C Velo
-
Pop Time
PBR At The Rock
Jun 18, 2021
Positional Tools
2023
2021
60 Yard Dash
The athlete's fastest 60-yard dash time in the given event year. Measured in seconds (s)
7.43
60 Yard Dash
The athlete's fastest 60-yard dash time in the given event year. Measured in seconds (s)
7.97
Infield Velocity
The athlete's maximum throwing velocity from an infield position in the given event year. Measured in miles per hour (MPH).
75.0
Power / Speed Score
A simple calculation that divides the athlete’s Exit Velocity Max by the athlete’s 60 Yard Dash time for the given event year. For example, 98 MPH / 7.00s = 14.00.
9.8
Hitting
2021
Exit Velocity Max
The highest exit velocity of any batted ball in the given event year. Measured in miles per hour (MPH).
78.2
Exit Velocity Avg
Average exit velocity of all batted balls in the given event year. Measured in miles per hour (MPH).
71.6
Distance Max
The highest flight distance of any batted ball in the given event year. Measured in feet (ft).
275
Distance Avg
Average flight distance of all batted balls in the given event year. Measured in feet (ft).
217
Launch Angle Avg
Average launch angle of all batted balls in the given event year. Measured in degrees.
28.0302
Hard Hit %
Percentage of batted balls with exit velocities over 95 MPH in the given event year.
Sweet Spot %
Percentage of batted balls in the given event year with a launch angle between 8° and 32°.
Line Drive %
Percentage of batted balls with launch angles between 10 and 25 degrees in the given event year.
Fly Ball %
Percentage of batted balls with launch angles between 25 and 50 degrees in the given event year.
Ground Ball %
Percentage of batted balls with launch angles below 10 degrees in the given event year.
O'Hare Preseason I.D.
Mar 13, 2021
Trackman - Hitting
78.2
Exit Velocity (max)
71.6
Exit Velocity (avg)
217
Distance (avg)
275
Distance (max)
Sweet Spot %
Line Drive %
Fly Ball %
Ground Ball %
Hitting
2021
Hand Speed Max
The highest Peak Hand Speed of any swing in the given event year.
22.2
Hand Speed Avg
The average Peak Hand Speed for all swings in the given event year.
20.9
Bat Speed Max
The highest Bat Speed of any swing in the given event year.
63.2
Bat Speed Avg
The average Bat Speed for all swings in the given event year.
60.8
Rotational Acceleration Max
The highest Rotational Acceleration of any swing in the given event year.
Rotational Acceleration Avg
The average Rotational Acceleration for all swings in the given event year.
On-Plane Efficiency Max
The highest On-Plane Efficiency of any swing in the given event year.
On-Plane Efficiency Avg
The average On-Plane Efficiency for all swings in the given event year.
O'Hare Preseason ID
Feb 13, 2022
Blast - Hitting
20.8
Hand Speed (max)
20.1
Hand Speed (avg)
70.5
Bat Speed (max)
66.8
Bat Speed (avg)
Rot. Acc (max)
Rot. Acc (avg)
On Plane Eff (avg)
O'Hare Preseason I.D.
Mar 13, 2021
Blast - Hitting
22.2
Hand Speed (max)
20.9
Hand Speed (avg)
63.2
Bat Speed (max)
60.8
Bat Speed (avg)
Rot. Acc (max)
Rot. Acc (avg)
On Plane Eff (avg)
MaxOnPlaneEfficiency
Pitching
2023
2022
2021
Fastball
Velocity Max
The maximum observed fastball velocity in the given event year. Measured in miles per hour (MPH).
83.3
Fastball
Velocity Avg
The average velocity for all pitches of this type in the given event year. Measured in miles per hour (MPH).
81.5
Fastball
Spin Rate Avg
The average rate of spin for all pitches of this type in the given event year. Measured in rotations per minute (RPM).
1984
Fastball
Spin Score Avg
The average Bauer Units value of all fastballs in the given event year. Bauer Units are calculated for each pitch by dividing Spin Rate by Velocity.
24.4
Fastball
Total Movement Avg
The average total non-gravity movement for all pitches of this type in the given event year. Measured in inches (in).
Changeup
Velocity Avg
The average velocity for all pitches of this type in the given event year. Measured in miles per hour (MPH).
72.0
Changeup
Spin Rate Avg
The average rate of spin for all pitches of this type in the given event year. Measured in rotations per minute (RPM).
1720
Changeup
Total Movement Avg
The average total non-gravity movement for all pitches of this type in the given event year. Measured in inches (in).
Slider
Velocity Avg
The average velocity for all pitches of this type in the given event year. Measured in miles per hour (MPH).
64.4
Slider
Spin Rate Avg
The average rate of spin for all pitches of this type in the given event year. Measured in rotations per minute (RPM).
1836
Slider
Total Movement Avg
The average total non-gravity movement for all pitches of this type in the given event year. Measured in inches (in).
Sinker
Velocity Avg
The average velocity for all pitches of this type in the given event year. Measured in miles per hour (MPH).
81.2
Sinker
Spin Rate Avg
The average rate of spin for all pitches of this type in the given event year. Measured in rotations per minute (RPM).
1975
Sinker
Total Movement Avg
The average total non-gravity movement for all pitches of this type in the given event year. Measured in inches (in).
Fastball
Velocity Max
The maximum observed fastball velocity in the given event year. Measured in miles per hour (MPH).
79.8
Fastball
Velocity Avg
The average velocity for all pitches of this type in the given event year. Measured in miles per hour (MPH).
79.1
Fastball
Spin Rate Avg
The average rate of spin for all pitches of this type in the given event year. Measured in rotations per minute (RPM).
1790
Fastball
Spin Score Avg
The average Bauer Units value of all fastballs in the given event year. Bauer Units are calculated for each pitch by dividing Spin Rate by Velocity.
22.6
Fastball
Total Movement Avg
The average total non-gravity movement for all pitches of this type in the given event year. Measured in inches (in).
Curveball
Velocity Avg
The average velocity for all pitches of this type in the given event year. Measured in miles per hour (MPH).
64.9
Curveball
Spin Rate Avg
The average rate of spin for all pitches of this type in the given event year. Measured in rotations per minute (RPM).
1597
Curveball
Total Movement Avg
The average total non-gravity movement for all pitches of this type in the given event year. Measured in inches (in).
Changeup
Velocity Avg
The average velocity for all pitches of this type in the given event year. Measured in miles per hour (MPH).
71.7
Changeup
Spin Rate Avg
The average rate of spin for all pitches of this type in the given event year. Measured in rotations per minute (RPM).
1673
Changeup
Total Movement Avg
The average total non-gravity movement for all pitches of this type in the given event year. Measured in inches (in).
Fastball
Velocity Max
The maximum observed fastball velocity in the given event year. Measured in miles per hour (MPH).
73.3
Fastball
Velocity Avg
The average velocity for all pitches of this type in the given event year. Measured in miles per hour (MPH).
72.7
Fastball
Spin Rate Avg
The average rate of spin for all pitches of this type in the given event year. Measured in rotations per minute (RPM).
1962
Fastball
Spin Score Avg
The average Bauer Units value of all fastballs in the given event year. Bauer Units are calculated for each pitch by dividing Spin Rate by Velocity.
27.0
Fastball
Total Movement Avg
The average total non-gravity movement for all pitches of this type in the given event year. Measured in inches (in).
Curveball
Velocity Avg
The average velocity for all pitches of this type in the given event year. Measured in miles per hour (MPH).
60.6
Curveball
Spin Rate Avg
The average rate of spin for all pitches of this type in the given event year. Measured in rotations per minute (RPM).
1651
Curveball
Total Movement Avg
The average total non-gravity movement for all pitches of this type in the given event year. Measured in inches (in).
Changeup
Velocity Avg
The average velocity for all pitches of this type in the given event year. Measured in miles per hour (MPH).
66.5
Changeup
Spin Rate Avg
The average rate of spin for all pitches of this type in the given event year. Measured in rotations per minute (RPM).
1572
Changeup
Total Movement Avg
The average total non-gravity movement for all pitches of this type in the given event year. Measured in inches (in).
Illinois State Games (Invite-Only)
Aug 8, 2023
Trackman - Fastball
83.3
Velocity (max)
81.5 - 82.8
Velo Range
81.3
Eff Velocity (avg)
2,095
Spin Rate (max)
1,969
Spin Rate (avg)
IVB (max)
IVB (avg)
HM (max)
HM (avg)
Extension (avg)
Release Ht (avg)
Spin Score (max)
Zone %
Spin Efficiency % (avg)
Trackman - Slider
67.3
Velocity (max)
66.2 - 67.3
Velo Range
64.6
Eff Velocity (avg)
2,006
Spin Rate (max)
1,909
Spin Rate (avg)
IVB (max)
IVB (avg)
HM (max)
HM (avg)
Extension (avg)
Release Ht (avg)
Spin Score (max)
Zone %
Spin Efficiency % (avg)
Trackman - ChangeUp
74.4
Velocity (max)
72.9 - 74.3
Velo Range
72.5
Eff Velocity (avg)
1,880
Spin Rate (max)
1,697
Spin Rate (avg)
IVB (max)
IVB (avg)
HM (max)
HM (avg)
Extension (avg)
Release Ht (avg)
Spin Score (max)
Zone %
Spin Efficiency % (avg)
Trackman - Sinker
82.9
Velocity (max)
81.5 - 82.8
Velo Range
81.4
Eff Velocity (avg)
2,052
Spin Rate (max)
1,997
Spin Rate (avg)
IVB (max)
IVB (avg)
HM (max)
HM (avg)
Extension (avg)
Release Ht (avg)
Spin Score (max)
Zone %
Spin Efficiency % (avg)
O'Hare Preseason ID
Feb 12, 2023
Trackman - Fastball
80.5
Velocity (max)
78.2 - 80.0
Velo Range
79.0
Eff Velocity (avg)
2,088
Spin Rate (max)
2,036
Spin Rate (avg)
IVB (max)
IVB (avg)
HM (max)
HM (avg)
Extension (avg)
Release Ht (avg)
Spin Score (max)
Zone %
Spin Efficiency % (avg)
Trackman - Slider
64.7
Velocity (max)
62.2 - 64.3
Velo Range
62.2
Eff Velocity (avg)
1,944
Spin Rate (max)
1,800
Spin Rate (avg)
IVB (max)
IVB (avg)
HM (max)
HM (avg)
Extension (avg)
Release Ht (avg)
Spin Score (max)
Spin Efficiency % (avg)
Trackman - ChangeUp
70.2
Velocity (max)
68.7 - 70.2
Velo Range
69.3
Eff Velocity (avg)
1,806
Spin Rate (max)
1,754
Spin Rate (avg)
IVB (max)
IVB (avg)
HM (max)
HM (avg)
Extension (avg)
Release Ht (avg)
Spin Score (max)
Zone %
Spin Efficiency % (avg)
Trackman - Sinker
80.6
Velocity (max)
78.6 - 80.3
Velo Range
79.4
Eff Velocity (avg)
2,006
Spin Rate (max)
1,931
Spin Rate (avg)
IVB (max)
IVB (avg)
HM (max)
HM (avg)
Extension (avg)
Release Ht (avg)
Spin Score (max)
Zone %
Spin Efficiency % (avg)
O'Hare Preseason ID
Feb 13, 2022
Trackman - Fastball
79.8
Velocity (max)
78.4 - 79.8
Velo Range
78.0
Eff Velocity (avg)
1,838
Spin Rate (max)
1,790
Spin Rate (avg)
IVB (max)
IVB (avg)
HM (max)
HM (avg)
Extension (avg)
Release Ht (avg)
Spin Score (max)
Zone %
Trackman - Curveball
66.6
Velocity (max)
63.8 - 66.2
Velo Range
63.2
Eff Velocity (avg)
1,763
Spin Rate (max)
1,597
Spin Rate (avg)
IVB (max)
IVB (avg)
HM (max)
HM (avg)
Extension (avg)
Release Ht (avg)
Spin Score (max)
Trackman - ChangeUp
72.6
Velocity (max)
70.5 - 72.6
Velo Range
70.9
Eff Velocity (avg)
1,793
Spin Rate (max)
1,673
Spin Rate (avg)
IVB (max)
IVB (avg)
HM (max)
HM (avg)
Extension (avg)
Release Ht (avg)
Spin Score (max)
Zone %
O'Hare Preseason I.D.
Mar 13, 2021
Trackman - Fastball
73.3
Velocity (max)
72.3 - 73.1
Velo Range
70.7
Eff Velocity (avg)
2,006
Spin Rate (max)
1,962
Spin Rate (avg)
IVB (max)
IVB (avg)
HM (max)
HM (avg)
Extension (avg)
Release Ht (avg)
Spin Score (max)
Zone %
Trackman - Curveball
61.3
Velocity (max)
60.1 - 61.2
Velo Range
58.7
Eff Velocity (avg)
1,773
Spin Rate (max)
1,651
Spin Rate (avg)
IVB (max)
IVB (avg)
HM (max)
HM (avg)
Extension (avg)
Release Ht (avg)
Spin Score (max)
Zone %
Trackman - ChangeUp
67.4
Velocity (max)
65.9 - 67.1
Velo Range
64.6
Eff Velocity (avg)
1,715
Spin Rate (max)
1,572
Spin Rate (avg)
IVB (max)
IVB (avg)
HM (max)
HM (avg)
Extension (avg)
Release Ht (avg)
Spin Score (max)
Zone %
Pitch Scores
2023
2022
2021
Fastball
Hop+
A fastball with hop has a flat approach angle and visually jumps through the zone. When thrown up in the zone, it is more likely to generate a higher swing and miss average. Hop+ of 100 is MLB average.
Fastball
Sink+
A fastball with sink has low backspin and drops through the strike zone. When thrown down in the zone, it is more likely to generate a higher ground ball percentage and lower launch angle. Sink+ of 100 is MLB average.
Fastball
Rise+
A fastball with rise has a high percentage of backspin. When thrown up in the zone, it is more likely to generate a higher fly ball percentage. Rise+ of 100 is MLB average
Sinker
Hop+
A fastball with hop has a flat approach angle and visually jumps through the zone. When thrown up in the zone, it is more likely to generate a higher swing and miss average. Hop+ of 100 is MLB average.
Sinker
Sink+
A fastball with sink has low backspin and drops through the strike zone. When thrown down in the zone, it is more likely to generate a higher ground ball percentage and lower launch angle. Sink+ of 100 is MLB average.
Sinker
Rise+
A fastball with rise has a high percentage of backspin. When thrown up in the zone, it is more likely to generate a higher fly ball percentage. Rise+ of 100 is MLB average
Slider
Hammer+
A hammer breaking ball drops vertically with velocity through the zone, or 12-to-6 movement. Hammer+ of 100 is MLB average.
Slider
Sweep+
A sweeping breaking ball moves horizontally with velocity through the zone. Sweep+ of 100 is MLB average.
Fastball
Rise+
A fastball with rise has a high percentage of backspin. When thrown up in the zone, it is more likely to generate a higher fly ball percentage. Rise+ of 100 is MLB average
Curveball
Hammer+
A hammer breaking ball drops vertically with velocity through the zone, or 12-to-6 movement. Hammer+ of 100 is MLB average.
Curveball
Sweep+
A sweeping breaking ball moves horizontally with velocity through the zone. Sweep+ of 100 is MLB average.
Fastball
Hop+
A fastball with hop has a flat approach angle and visually jumps through the zone. When thrown up in the zone, it is more likely to generate a higher swing and miss average. Hop+ of 100 is MLB average.
Fastball
Sink+
A fastball with sink has low backspin and drops through the strike zone. When thrown down in the zone, it is more likely to generate a higher ground ball percentage and lower launch angle. Sink+ of 100 is MLB average.
Fastball
Rise+
A fastball with rise has a high percentage of backspin. When thrown up in the zone, it is more likely to generate a higher fly ball percentage. Rise+ of 100 is MLB average
Curveball
Hammer+
A hammer breaking ball drops vertically with velocity through the zone, or 12-to-6 movement. Hammer+ of 100 is MLB average.
Curveball
Sweep+
A sweeping breaking ball moves horizontally with velocity through the zone. Sweep+ of 100 is MLB average.
O'Hare Preseason ID
Feb 12, 2023
Pitch Scores - Fastball
Hop+
Rise+
Sink+
Pitch Scores - Sinker
Hop+
Sink+
Rise+
Pitch Scores - Slider
Hammer+
Sweep+
Pitching Velos
2024
2023
2022
2021
Fastball
Velocity Max
The maximum observed fastball velocity in the given event year. Measured in miles per hour (MPH).
83.0
Fastball
Velocity Avg
The average velocity for all pitches of this type in the given event year. Measured in miles per hour (MPH)
82.0
Curveball
Velocity Avg
The average velocity for all pitches of this type in the given event year. Measured in miles per hour (MPH)
66.5
Changeup
Velocity Avg
The average velocity for all pitches of this type in the given event year. Measured in miles per hour (MPH)
74.0
Fastball
Velocity Max
The maximum observed fastball velocity in the given event year. Measured in miles per hour (MPH).
83.0
Fastball
Velocity Avg
The average velocity for all pitches of this type in the given event year. Measured in miles per hour (MPH)
80.9
Changeup
Velocity Avg
The average velocity for all pitches of this type in the given event year. Measured in miles per hour (MPH)
71.1
Slider
Velocity Avg
The average velocity for all pitches of this type in the given event year. Measured in miles per hour (MPH)
64.8
Fastball
Velocity Max
The maximum observed fastball velocity in the given event year. Measured in miles per hour (MPH).
81.0
Fastball
Velocity Avg
The average velocity for all pitches of this type in the given event year. Measured in miles per hour (MPH)
79.2
Curveball
Velocity Avg
The average velocity for all pitches of this type in the given event year. Measured in miles per hour (MPH)
68.0
Changeup
Velocity Avg
The average velocity for all pitches of this type in the given event year. Measured in miles per hour (MPH)
72.0
Fastball
Velocity Max
The maximum observed fastball velocity in the given event year. Measured in miles per hour (MPH).
75.0
Fastball
Velocity Avg
The average velocity for all pitches of this type in the given event year. Measured in miles per hour (MPH)
73.5
Curveball
Velocity Avg
The average velocity for all pitches of this type in the given event year. Measured in miles per hour (MPH)
61.2
Changeup
Velocity Avg
The average velocity for all pitches of this type in the given event year. Measured in miles per hour (MPH)
66.5
Game Performance
2023
10 Yard Dash
The athlete's fastest 0-10-yard split time in the given event year. Measured in seconds.
1.69
30 Yard Dash
The athlete's fastest 0-30-yard split time in the given event year. Measured in seconds.
4.05
60 Yard Dash
The athlete's fastest 0-60-yard time in the given event year. Measured in seconds.
7.43
Top Speed (MPH)
The athlete's fastest split time converted to miles per hour.
RSi
The reactive strength index measurement of an athlete's explosiveness by comparing their jump height to the ground contact time in between their jumps. On a scale of 0-5.
Vertical Jump
A measure of any athlete's body strength and reach calculated from the flight time divided by the contact time.
O'Hare Preseason ID
Feb 12, 2023
Swift
1.69
10-yd
4.05
30-yd
7.43
60-yd
18.2
Run speed (max)
1.68
RSI (max)
1.68
RSI (avg)
1,848
Jump Power (max)
32.5
Jump Height (max)
32.0
Jump Height (avg)
Vizual Edge
Pitch Ai
Notes
News
- Illinois Class of 2024: D1 Impact Performers - Jun 2, 2025
- 2024 Prep Baseball Illinois Third Team All-State - Jun 21, 2024
- 2024 Metro East Kickoff Classic: Scout Blog - Mar 24, 2024
- Preseason Power 25 Countdown: No. 6 New Trier - Mar 10, 2024
- Illinois Signing Day: More Division I Signees - Dec 14, 2023
- Illinois State Games: 2024 Pitcher Analysis - Oct 25, 2023
- Illinois State Games Takeaways: 2024s - Aug 16, 2023
- IHSA Playoff Scout Blog - Jun 26, 2023
- Brother Rice Secures Spot In 4A State Championship With Win Over New Trier - Jun 9, 2023
- 4A IHSA State Playoffs Preview - Jun 8, 2023
- O'Hare Preseason ID: Pitcher Analysis - May 4, 2023
- Week 6 Games - Apr 25, 2023
- Preseason Power 25 Countdown: No. 18 New Trier - Mar 9, 2023
- O'Hare Preseason ID: Pitcher Analysis - May 12, 2022
- O'Hare Preseason ID: TrackMan Files - Feb 18, 2022
Comments
Draft Reports
Contact
Premium Content Area
To unlock contact information, you need to purchase a ScoutPLUS subscription.
Purchase Subscription OR
Login

Sign in to view rankings
USC-Upstate commit. Currently ranked No. 59 in the Illinois’ 2024 class. 6-foot-1, 184-pound, left-handed pitcher with a well-proportioned frame. Got the start on the mound and continues to look like one of the more polished left-handed arms in the class. Starter profile, true three pitch mix with all kinds of pitchability. Can throw any pitch in any count and goes often to a swing-and-miss changeup that has advanced action, running away from a right-handed hitters barrel; advanced feel and sat 73-75 mph. The changeup makes his 81-83 mph fastball play up and he also mixed in a 66-67 mph curveball that flashes depth off a 1/7 plane. Threw 49-70 (70%) pitches for a strike. Ended up going five innings, five hits, one run, struck out six and did not walk a batter. Quality look at the talented southpaw.
Verbally committed to USC-Upstate.
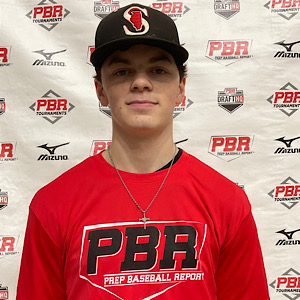
LHP Max Kaplan (New Trier, 2024) showed impressive pitchability during his three innings on the mound. The 6-foot-1, 180-pound southpaw has been trending up this summer after a successful spring for the New Trier Trevians. Kaplan displayed a clean operation on the mound with a sequenced delivery. Filled up the zone with a fastball that worked in the low-80s, T83.3 mph with noticeable arm-side run. Often went to a low-70s changeup that played with fade to get swings and misses. Tallied five strikeouts during his outing. Works quickly with a competitive demeanor. Kaplan is an uncommitted follow in the state’s 2024 class that continues to trend up as the year continues.
Positional Profile: LHP/LHP
Body: 6-1, 180-pounds.
Delivery: Up-tempo, high leg lift into tall/fall delivery, toe lands slightly open. Pounded the zone in his three innings of work and struck out five with no walks.
Arm Action: LH. Short, clean arm action, 3/4 slot.
FB: T83, 82-83 mph. SNK: Clear sink and run to the armside. FB: Mostly straight actions. T2095, 1969 average rpm.
SL: 66-67 mph. Clear horizontal movement, can land for strikes. T2006, 1909 average rpm.
CH: 73-74 mph. Tunnels well, keeps down, clear fade. T1880, 1697 average rpm.
Uncommitted. 6-foot-1, 180 pounds upside athlete with loose, lean levers that are capable of tacking on strength. Toed the rubber for the Trevians in the semifinal game against Brother Rice. Relaxed presence on the rubber, long-triding delivery with a freely moving lower half, works across body some with deception. Long, loose arm action, finishes out of a ¾ slot. Heavy fastball played at 81-84 mph, worked with natural arm-side run and sink. Changeup played in the low-70s off his fastball’s plane, threw it at the same arm speed, too. Mixed in a mid-70s breaking ball with some depth off a 1/7 plane. An upside pitchability southpaw that’s comfortable using his entire arsenal and anchored the New Trier pitching staff throughout this spring season.
Uncommitted. Listed at 6-foot-1, 175-pounds, projectable with room to add on strength. In our brief look, Kaplan didn’t allow a single hit or run over 1.1 innings before the game was called for inclement weather. The southpaw cruised with his fastball at 82-83 mph, playing with sink and arm-side action. He went to a deceptive changeup, playing from a similar window with arm-speed and fading action. Polished left-hander with upside and feel to pitch, clean mover and athletic.
Positional Profile: LHP
Body: 6-1, 175-pounds. Athletic, lean build.
Delivery: Controlled wind up, high leg kick, rides down the mound.
Arm Action: LH. Low 3/4 slot, loose arm.
FB: T81, 78-80 mph. Plays with armside run, able to spot for strikes in the lower part of the zone.
SNK: Hard run, feel for the zone. T2088, 2036 average rpm.
SL: 62-64 mph. Sweeping action, can spot low in the zone, 10/5 shape. T1944, 1800 average rpm.
CH: 69-70 mph. Developing feel, fading action in the bottom part of the zone. T1806, 1754 average rpm.
Positional Profile: LHP
Body: 6-0, 165-pounds. Athletic build.
Delivery: Tall and fall type delivery. Works in rhythm. Lands squared.
Arm Action: LH. Long arm action, high 3/4 arm slot.
FB: T79.8, 78.4-79.8 mph. Plays straight. T1838, 1789 average rpm.
CB: 63.8-66.2 mph. 1/7 shape. Slight lateral action. T1763, 1596 average rpm.
CH: 70.5-72.6 mph. Consistent arm-side fade. Feel for the zone. T1792, 1673 average rpm.
Positional Profile: LHP/1B
Body: 5-8, 121-pounds.
Delivery: Drop and drive type delivery with a tall balance point and some rhythm. Body works in line, lands square.
Arm Action: LH. Long, loose arm action. Works from a high 3/4 angle.
FB: T73, 72-73 mph. Fastball plays mostly straight with occasional downhill tilt. T2005, 1962 average rpm.
CB: 60-61 mph. Maintains near fastball arm speed. 12/6 shape with gradual action and depth. T1772, 1651 average rpm.
CH: 66-67 mph. Maintains fastball arm speed. Plays with nice fading action. Showed solid feel for his changeup. T1714, 1572 average rpm.
Hit: LHH. Sets up in an open stance with a short stride. Hands draw back into load. Short and direct swing to the baseball with fluid rhythm.
Power: 78.2 max exit velocity, averaged 71.59 mph. 275’ max distance.
Arm: LH. INF - 75 mph. Short and loose arm action, releases from a high 3/4 window.
Defense: Natural actions at first base. Showed off solid footwork around the bag.
Run: 7.97 runner in the 60.