CLASS OF 2027
OF
LHP
Prescott
Sanford
Franklin (HS) • WI
5' 10" • 175LBS
L/L • 17yr 1mo
Travel Team: Hitter's u16 Navy
5' 10" • 175LBS
L/L • 17yr 1mo
Travel Team: Hitter's u16 Navy
Rankings
2027 National
Rankings available to Premium Subscriber
2027 State
Rankings available to Premium Subscriber
Commitment
UNCOMMITTED
Player has made a commitment?
Tell us where
Best Of Stats
25.2
Hand Speed (max)
7/25/23
73
Bat Speed (max)
7/25/23
19.8
Rot. Acc (max)
7/25/23
-
Hard Hit %
85
Exit Velocity (max)
3/22/23
74.1
Exit Velocity (avg)
7/25/23
255
Distance (max)
7/25/23
88
Sweet Spot %
7/25/23
7.29
60-yd
7/25/23
4.03
30-yd
7/25/23
1.69
10-yd
7/25/23
18.8
Run speed (max)
7/25/23
-
INF Velo
77
OF Velo
3/22/23
-
C Velo
-
Pop Time
Fastball
86
Velocity (max)
3/08/26
83 - 85
Velo Range
3/08/26
1955
Spin Rate (avg)
3/08/26
Changeup
74 - 76
Velo Range
3/08/26
1406
Spin Rate (avg)
3/22/23
Curveball
73 - 74
Velo Range
3/08/26
2028
Spin Rate (avg)
3/08/26
Slider
65.2 - 67.3
Velo Range
3/22/23
1474
Spin Rate (avg)
3/22/23
Positional Tools
2023
60 Yard Dash
The athlete's fastest 60-yard dash time in the given event year. Measured in seconds (s)
7.64
Outfield Velocity
The athlete's maximum throwing velocity from an outfield position in the given event year. Measured in miles per hour (MPH).
77.0
Power / Speed Score
A simple calculation that divides the athlete’s Exit Velocity Max by the athlete’s 60 Yard Dash time for the given event year. For example, 98 MPH / 7.00s = 14.00.
11.1
Hitting
2023
Exit Velocity Max
The highest exit velocity of any batted ball in the given event year. Measured in miles per hour (MPH).
85.0
Exit Velocity Avg
Average exit velocity of all batted balls in the given event year. Measured in miles per hour (MPH).
74.0
Distance Max
The highest flight distance of any batted ball in the given event year. Measured in feet (ft).
255
Distance Avg
Average flight distance of all batted balls in the given event year. Measured in feet (ft).
157
Launch Angle Avg
Average launch angle of all batted balls in the given event year. Measured in degrees.
17.4995
Hard Hit %
Percentage of batted balls with exit velocities over 95 MPH in the given event year.
Sweet Spot %
Percentage of batted balls in the given event year with a launch angle between 8° and 32°.
Line Drive %
Percentage of batted balls with launch angles between 10 and 25 degrees in the given event year.
Fly Ball %
Percentage of batted balls with launch angles between 25 and 50 degrees in the given event year.
Ground Ball %
Percentage of batted balls with launch angles below 10 degrees in the given event year.
PBR Junior Future Games
Jul 25, 2023
Trackman - Hitting
82.3
Exit Velocity (max)
74.1
Exit Velocity (avg)
202
Distance (avg)
255
Distance (max)
Sweet Spot %
Line Drive %
Fly Ball %
Ground Ball %
JFG Workout IL/WI/CA
Jul 25, 2023
Trackman - Hitting
82.3
Exit Velocity (max)
74.1
Exit Velocity (avg)
202
Distance (avg)
255
Distance (max)
Sweet Spot %
Line Drive %
Fly Ball %
Ground Ball %
South Milwaukee Rising Stars ID
Mar 22, 2023
Trackman - Hitting
85.0
Exit Velocity (max)
73.8
Exit Velocity (avg)
121
Distance (avg)
241
Distance (max)
Sweet Spot %
Line Drive %
Fly Ball %
Ground Ball %
Hitting
2023
Hand Speed Max
The highest Peak Hand Speed of any swing in the given event year.
25.2
Hand Speed Avg
The average Peak Hand Speed for all swings in the given event year.
24.3
Bat Speed Max
The highest Bat Speed of any swing in the given event year.
73.0
Bat Speed Avg
The average Bat Speed for all swings in the given event year.
70.6
Rotational Acceleration Max
The highest Rotational Acceleration of any swing in the given event year.
Rotational Acceleration Avg
The average Rotational Acceleration for all swings in the given event year.
On-Plane Efficiency Max
The highest On-Plane Efficiency of any swing in the given event year.
On-Plane Efficiency Avg
The average On-Plane Efficiency for all swings in the given event year.
PBR Junior Future Games
Jul 25, 2023
Blast - Hitting
25.2
Hand Speed (max)
24.3
Hand Speed (avg)
73.0
Bat Speed (max)
70.6
Bat Speed (avg)
Rot. Acc (max)
Rot. Acc (avg)
On Plane Eff (avg)
MaxOnPlaneEfficiency
JFG Workout IL/WI/CA
Jul 25, 2023
Blast - Hitting
25.2
Hand Speed (max)
24.3
Hand Speed (avg)
73.0
Bat Speed (max)
70.6
Bat Speed (avg)
Rot. Acc (max)
Rot. Acc (avg)
On Plane Eff (avg)
MaxOnPlaneEfficiency
Pitching
2026
2023
Fastball
Velocity Max
The maximum observed fastball velocity in the given event year. Measured in miles per hour (MPH).
85.9
Fastball
Velocity Avg
The average velocity for all pitches of this type in the given event year. Measured in miles per hour (MPH).
84.0
Fastball
Spin Rate Avg
The average rate of spin for all pitches of this type in the given event year. Measured in rotations per minute (RPM).
1955
Fastball
Spin Score Avg
The average Bauer Units value of all fastballs in the given event year. Bauer Units are calculated for each pitch by dividing Spin Rate by Velocity.
23.3
Fastball
Total Movement Avg
The average total non-gravity movement for all pitches of this type in the given event year. Measured in inches (in).
Curveball
Velocity Avg
The average velocity for all pitches of this type in the given event year. Measured in miles per hour (MPH).
73.2
Curveball
Spin Rate Avg
The average rate of spin for all pitches of this type in the given event year. Measured in rotations per minute (RPM).
2028
Curveball
Total Movement Avg
The average total non-gravity movement for all pitches of this type in the given event year. Measured in inches (in).
Changeup
Velocity Avg
The average velocity for all pitches of this type in the given event year. Measured in miles per hour (MPH).
74.9
Changeup
Spin Rate Avg
The average rate of spin for all pitches of this type in the given event year. Measured in rotations per minute (RPM).
1002
Changeup
Total Movement Avg
The average total non-gravity movement for all pitches of this type in the given event year. Measured in inches (in).
Sinker
Velocity Avg
The average velocity for all pitches of this type in the given event year. Measured in miles per hour (MPH).
82.7
Sinker
Spin Rate Avg
The average rate of spin for all pitches of this type in the given event year. Measured in rotations per minute (RPM).
1859
Sinker
Total Movement Avg
The average total non-gravity movement for all pitches of this type in the given event year. Measured in inches (in).
Fastball
Velocity Max
The maximum observed fastball velocity in the given event year. Measured in miles per hour (MPH).
77.7
Fastball
Velocity Avg
The average velocity for all pitches of this type in the given event year. Measured in miles per hour (MPH).
74.8
Fastball
Spin Rate Avg
The average rate of spin for all pitches of this type in the given event year. Measured in rotations per minute (RPM).
1905
Fastball
Spin Score Avg
The average Bauer Units value of all fastballs in the given event year. Bauer Units are calculated for each pitch by dividing Spin Rate by Velocity.
25.5
Fastball
Total Movement Avg
The average total non-gravity movement for all pitches of this type in the given event year. Measured in inches (in).
Changeup
Velocity Avg
The average velocity for all pitches of this type in the given event year. Measured in miles per hour (MPH).
67.5
Changeup
Spin Rate Avg
The average rate of spin for all pitches of this type in the given event year. Measured in rotations per minute (RPM).
1406
Changeup
Total Movement Avg
The average total non-gravity movement for all pitches of this type in the given event year. Measured in inches (in).
Slider
Velocity Avg
The average velocity for all pitches of this type in the given event year. Measured in miles per hour (MPH).
66.3
Slider
Spin Rate Avg
The average rate of spin for all pitches of this type in the given event year. Measured in rotations per minute (RPM).
1474
Slider
Total Movement Avg
The average total non-gravity movement for all pitches of this type in the given event year. Measured in inches (in).
South Milwaukee Preseason ID
Mar 8, 2026
Trackman - Fastball
85.9
Velocity (max)
83.0 - 85.0
Velo Range
83.9
Eff Velocity (avg)
2,182
Spin Rate (max)
1,955
Spin Rate (avg)
IVB (max)
IVB (avg)
HM (max)
HM (avg)
Extension (avg)
Release Ht (avg)
Spin Score (max)
Zone %
Spin Efficiency % (avg)
Trackman - Curveball
73.8
Velocity (max)
72.7 - 73.8
Velo Range
70.5
Eff Velocity (avg)
2,074
Spin Rate (max)
2,028
Spin Rate (avg)
IVB (max)
IVB (avg)
HM (max)
HM (avg)
Extension (avg)
Release Ht (avg)
Spin Score (max)
Zone %
Spin Efficiency % (avg)
Trackman - ChangeUp
75.8
Velocity (max)
74.3 - 75.6
Velo Range
72.3
Eff Velocity (avg)
1,077
Spin Rate (max)
1,002
Spin Rate (avg)
IVB (max)
IVB (avg)
HM (max)
HM (avg)
Extension (avg)
Release Ht (avg)
Spin Score (max)
Zone %
Spin Efficiency % (avg)
Trackman - Sinker
83.2
Velocity (max)
81.7 - 83.2
Velo Range
80.9
Eff Velocity (avg)
1,916
Spin Rate (max)
1,859
Spin Rate (avg)
IVB (max)
IVB (avg)
HM (max)
HM (avg)
Extension (avg)
Release Ht (avg)
Spin Score (max)
Zone %
Spin Efficiency % (avg)
South Milwaukee Rising Stars ID
Mar 22, 2023
Trackman - Fastball
77.7
Velocity (max)
72.5 - 77.0
Velo Range
72.9
Eff Velocity (avg)
2,035
Spin Rate (max)
1,905
Spin Rate (avg)
IVB (max)
IVB (avg)
HM (max)
HM (avg)
Extension (avg)
Release Ht (avg)
Spin Score (max)
Zone %
Spin Efficiency % (avg)
Trackman - Slider
67.7
Velocity (max)
65.2 - 67.3
Velo Range
63.3
Eff Velocity (avg)
1,634
Spin Rate (max)
1,474
Spin Rate (avg)
IVB (max)
IVB (avg)
HM (max)
HM (avg)
Extension (avg)
Release Ht (avg)
Spin Score (max)
Spin Efficiency % (avg)
Trackman - ChangeUp
68.6
Velocity (max)
66.8 - 68.3
Velo Range
65.8
Eff Velocity (avg)
1,466
Spin Rate (max)
1,406
Spin Rate (avg)
IVB (max)
IVB (avg)
HM (max)
HM (avg)
Extension (avg)
Release Ht (avg)
Spin Score (max)
Spin Efficiency % (avg)
Pitch Scores
Pitching Velos
2026
2023
Fastball
Velocity Max
The maximum observed fastball velocity in the given event year. Measured in miles per hour (MPH).
86.0
Fastball
Velocity Avg
The average velocity for all pitches of this type in the given event year. Measured in miles per hour (MPH)
84.0
Curveball
Velocity Avg
The average velocity for all pitches of this type in the given event year. Measured in miles per hour (MPH)
73.5
Changeup
Velocity Avg
The average velocity for all pitches of this type in the given event year. Measured in miles per hour (MPH)
75.0
Fastball
Velocity Max
The maximum observed fastball velocity in the given event year. Measured in miles per hour (MPH).
78.0
Fastball
Velocity Avg
The average velocity for all pitches of this type in the given event year. Measured in miles per hour (MPH)
74.2
Curveball
Velocity Avg
The average velocity for all pitches of this type in the given event year. Measured in miles per hour (MPH)
65.5
Changeup
Velocity Avg
The average velocity for all pitches of this type in the given event year. Measured in miles per hour (MPH)
66.5
Slider
Velocity Avg
The average velocity for all pitches of this type in the given event year. Measured in miles per hour (MPH)
66.0
Game Performance
2023
10 Yard Dash
The athlete's fastest 0-10-yard split time in the given event year. Measured in seconds.
1.69
30 Yard Dash
The athlete's fastest 0-30-yard split time in the given event year. Measured in seconds.
4.03
60 Yard Dash
The athlete's fastest 0-60-yard time in the given event year. Measured in seconds.
7.29
Top Speed (MPH)
The athlete's fastest split time converted to miles per hour.
2026
Vertical Jump
A measure of any athlete's body strength and reach calculated from the flight time divided by the contact time.
Vizual Edge
Pitch Ai
Notes
News
Comments
Draft Reports
Contact
Premium Content Area
To unlock contact information, you need to purchase a ScoutPLUS subscription.
Purchase Subscription OR
Login
Physical
2026
Grip Strgth (LH)
Grip strength is a measure of a players bat control and ability to transfer power and speed during impact, measured in pounds of force generated; collected with elbow bent at 90 degrees.
Grip Strgth (RH)
Grip strength is a measure of a players bat control and ability to transfer power and speed during impact, measured in pounds of force generated; collected with elbow bent at 90 degrees.

Sign in to view rankings
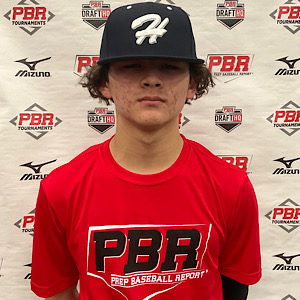
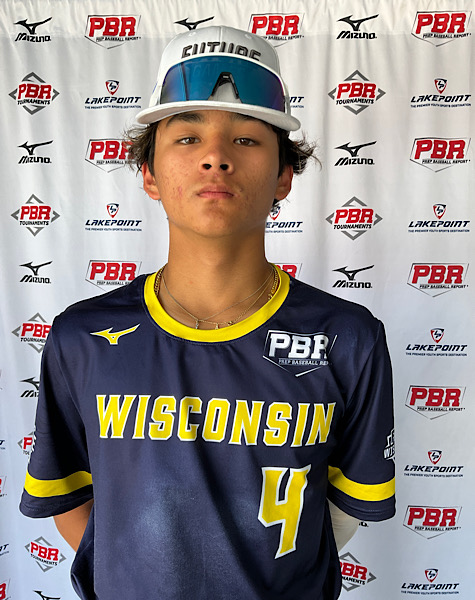
PBR Junior Future Games: OF/LHP Prescott Sanford (Franklin, 2027) was all over the barrel in Tuesday’s workout and will look to impress for Team Wisconsin at the Junior Future Games this week. With a maximum exit velocity of 82 mph, Sanford’s line-drive approach during BP showed why his bat is a follow across the event. The left-handed two-way displayed athletic movement patterns in his fielding session where he was in the upper-70’s. After impressing at The Rock Summer Championships in early June, Sanford will look to build upon his performances this week.
Prescott Sanford, Franklin (WI), 2027
Positional Profile: OF/LHP
Body: 5-8, 150-pounds. Athletic, projectable frame.
Delivery: Methodical delivery, high leg kick, in-line stride to the plate.
Arm Action: LH. Continuous arm action, into a high 3/4 slot.
FB: T78, 72-77 mph. Life through the zone with carry. T2035, 1905 average rpm.
SL: 65-67 mph. Plays with depth, developing feel for the zone. T1634, 1474 average rpm.
CH: 67-68 mph. Running action, thrown with intent. T1466, 1406 average rpm.
ATH: 7.64 runner in the 60. 1.80 and 4.16 in the 10 and 30 yard splits.
Prescott Sanford, Franklin (WI), 2027
Positional Profile: OF/LHP
Body: 5-8, 150-pounds. Athletic, projectable frame.
Hit: LHH. Stands in a balanced set up with centered hands. Short toe-tap stride, draws hands back into slight arm bar. Direct path with quick hands, attacks top down creates back spin to both gaps.
Power: 85 max exit velocity, averaged 73.8 mph. 241' max distance.
Arm: LH. OF-77 mph. Aggressive through the ball, shuffle step with good direction.
ATH: 7.64 runner in the 60. 1.80 and 4.16 in the 10 and 30 yard splits.