The Winter Pulse: February
March 5, 2026

Throughout this winter showcase season, we’ll be taking the time to put into perspective the highlight-worthy performances that elevate prospects from our open Preseason ID events into need-to-know prospects within their regions or even the entire nation.
So, in this series, we’ll be spending some time highlighting the prospects who participated in recent Preseason ID events and performed like some of the best players in their backyards.
UPCOMING PRESEASON ID EVENTS
| Date | Event | Location |
| Saturday, March 7 | North Dakota PID | Fargo, ND |
| Saturday, March 7 | South Milwaukee PID | Racine, WI |
| Sunday, March 8 | Twin Cities PID | Savage, MN |
| Saturday, March 14 | Eau Claire PID | Lake Hallie, WI |
| Saturday, March 14 | Southern Indiana PID | New Albany, IN |
| Saturday, March 14 | Evansville PID | Evansville, IN |
| Sunday, March 15 | Madison PID | Windsor, WI |
| Saturday, March 21 | Milwaukee PID | Franklin, WI |
| Sunday, March 22 | Central Wisconsin PID | Mosinee, WI |
Find more upcoming Prep Baseball events here.
The leaderboards below contain statistics from the 66 Preseason ID-branded showcases that took place during the entire month of February that spanned the entire country.
TOP 60-YARD DASH
| Rank | Name | State | School | Class | Pos | 60-yd. |
| 1 | Marco Montesanti | NV | Shadow Ridge | 2027 | SS | 6.44 |
| 2 | Malcolm Donaldson | IL | Lincoln-Way East | 2028 | OF | 6.52 |
| 3 | Chace Staude | WI | Kettle Moraine | 2027 | OF | 6.56 |
| 4 | Bryce Valls | NY | Chaminade | 2027 | OF | 6.58 |
| 5 | Logan Peterson | WI | Pewaukee | 2027 | OF | 6.59 |
| 6 | Dillon Herling | WI | Franklin | 2027 | OF | 6.60 |
| 7 | Jayden Gigante | NY | H. Frank Carey | 2026 | OF | 6.62 |
| 8 | Jordan Meeker | IA | Muscatine | 2026 | OF | 6.64 |
| 9 | Jaxon Wepking | WI | Verona Area | 2027 | OF | 6.65 |
| ^ | Rogan Bailey | IN | Warsaw Community | 2028 | SS | 6.65 |
| ^ | Keenan Dolan | NV | Bishop Manogue | 2026 | RHP | 6.65 |
| 10 | Ryan Espinoza | IN | Hanover Central | 2028 | OF | 6.66 |
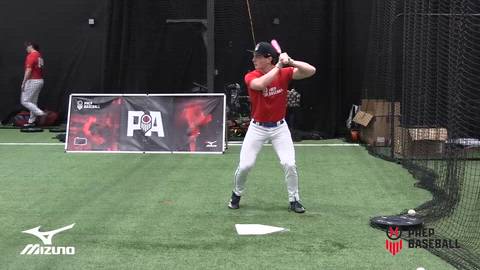
(Marco Montesanti; 2/11/26)
TRACKMAN HITTING LEADERS
EXIT VELOCITY (MAX)
| Rank | Name | State | School | Class | Pos | Exit Velocity (max) | Sweet Spot % |
| 1 | Parker Clubb | KS | Mulvane | 2026 | C | 108.9 mph | 44 % |
| 2 | Carter Taldo | KS | Olathe West | 2027 | OF | 107.2 mph | 87 % |
| 3 | Grayson Fontaine | PA | North Penn | 2028 | 1B | 106.9 mph | 45 % |
| 4 | Oliver Gibson | IL | Downers Grove North | 2027 | OF | 106.8 mph | 63 % |
| 5 | Karson Wiskur | MO | Smith-Cotton | 2028 | 3B | 106.3 mph | 62 % |
| 6 | DJ Brokaw | ID | Middleton | 2026 | OF | 106.1 mph | 61 % |
| 7 | Cooper Schaefgen | WI | Oconomowoc | 2027 | 3B | 106.1 mph | 71 % |
| 8 | Mason Cevette | PA | Cedar Crest | 2028 | RHP | 105.8 mph | 58 % |
| 9 | Tim Pirone | PA | Franklin Regional | 2028 | OF | 105.8 mph | 41 % |
| 10 | Tyler Ryan | PA | Malvern Prep | 2028 | OF | 105.7 mph | 33 % |
| 11 | Ryan Wilberding | IL | Libertyville | 2027 | C | 105.6 mph | 72 % |
| 12 | Bam Fenter | ID | Coeur D'Alene | 2026 | 3B | 105.5 mph | 36 % |
| 13 | Markus Jones | PA | Salisbury | 2027 | 3B | 105.5 mph | 41 % |
| 14 | Jackson Maddix | PA | Bishop Canevin | 2027 | LHP | 105.3 mph | 58 % |
| 15 | Cam Rakaczewski | PA | Greencastle-Antrim | 2028 | SS | 105.2 mph | 66 % |
(Carter Taldo; 2/14/26)
EXIT VELOCITY (AVG.)
| Rank | Name | State | School | Class | Pos | Exit Velocity (avg) | Sweet Spot % |
| 1 | Zayden Peltz | AZ | EVIT-Chandler | 2027 | OF | 100.6 mph | 42 % |
| 2 | Carter Taldo | KS | Olathe West | 2027 | OF | 100.2 mph | 87 % |
| 3 | Ayden Boyd | ID | Bishop Kelly | 2026 | OF | 99.7 mph | 50 % |
| 4 | Karson Wiskur | MO | Smith-Cotton | 2028 | 3B | 99.2 mph | 62 % |
| 5 | Jack Tooke | ND | Mandan | 2027 | RHP | 98.8 mph | 42 % |
| 6 | Michael Schaffer | PA | Episcopal Academy | 2028 | RHP | 98.7 mph | 70 % |
| 7 | Grayson Fontaine | PA | North Penn | 2028 | 1B | 98.4 mph | 45 % |
| 8 | Layne Rider | PA | Grove City Area | 2027 | 3B | 98.2 mph | 33 % |
| 9 | Collin Crumrine | IL | Normal Community | 2028 | 3B | 98.2 mph | 58 % |
| 10 | Cooper Schaefgen | WI | Oconomowoc | 2027 | 3B | 97.7 mph | 71 % |
| 11 | Markus Jones | PA | Salisbury | 2027 | 3B | 97.6 mph | 41 % |
| 12 | Aidan Gamble | PA | Downingtown West | 2028 | 1B | 97.6 mph | 20 % |
| 13 | Spencer Deitz | NV | Damonte Ranch | 2026 | 1B | 97.3 mph | 68 % |
| 14 | Kael Wischmeier | IA | Mediapolis | 2027 | 3B | 97.0 mph | 80 % |
| 15 | Mason Cevette | PA | Cedar Crest | 2028 | RHP | 97.0 mph | 58 % |
Exit Velocity: This metric measures the speed of the ball, measured in miles per hour, as it comes off the bat at the moment of contact.
Sweet Spot percentage: This metric is determined by how often the player produces a batted ball during the session with a launch angle between 8 to 32 degrees.
(Zayden Peltz; 2/1/26)
BLAST MOTION LEADERS
BAT SPEED (AVG.)
| Rank | Name | State | School | Class | Pos | Bat Speed (avg) |
| 1 | Jimmy Amplo | PA | The Shipley School | 2027 | OF | 82.7 mph |
| 2 | Ethan Flavel | WA | Decatur | 2027 | 3B | 79.7 mph |
| 3 | Gavin Greene | CO | Legacy | 2027 | 3B | 79.4 mph |
| 4 | Aiden Herner | ND | Century | 2027 | OF | 79.0 mph |
| 5 | John DiLandri | NV | Homeschool (NV) | 2028 | OF | 78.8 mph |
| 6 | Hunter Mason | IN | Sullivan | 2027 | 3B | 78.3 mph |
| 7 | Tim Pirone | PA | Franklin Regional | 2028 | OF | 78.1 mph |
| 8 | Penn Joyce | NC | Cary | 2028 | OF | 78.1 mph |
| 9 | Brayden Leavitt | NV | Shadow Ridge | 2027 | OF | 77.8 mph |
| 10 | Kaeden Chapman | OR | McMinnville | 2026 | 1B | 77.7 mph |
| 11 | Alex Shaffer | PA | Annville Cleona | 2027 | 3B | 77.4 mph |
| 12 | Max Wiginton | IL | McHenry | 2027 | 1B | 77.4 mph |
| 13 | Jacob Todd | KY | George Rogers Clark | 2027 | C | 77.3 mph |
| 14 | Adam McDowell | PA | Conestoga Valley | 2027 | OF | 77.1 mph |
| 15 | Anthony Rochford | IN | Chesterton Senior | 2027 | OF | 77.0 mph |
Bat Speed: The observed speed of the sweet spot of the bat at impact. The sweet spot of the bat is measured six inches from the tip of the bat.
(Aiden Herner; 2/21/26)
ROTATIONAL ACCELERATION (AVG.)
| Rank | Name | State | School | Class | Pos | Rot. Acc (avg) |
| 1 | Lucas Genareo | NY | Southwestern Central | 2028 | RHP | 33.2 g |
| 2 | Tav Hiaring | ID | Mountain View | 2027 | C | 33.2 g |
| 3 | Grayson Virkler | NY | East Syracuse Minoa | 2027 | RHP | 33.2 g |
| 4 | Keenan Dolan | NV | Bishop Manogue | 2026 | RHP | 33.1 g |
| 5 | Chase Mitcheltree | PA | Wilmington Area | 2027 | OF | 32.8 g |
| 6 | Will Marciniec | IN | Westfield | 2028 | OF | 31.7 g |
| 7 | Jackson Winkelman | NY | St Francis | 2029 | C | 30.4 g |
| 8 | Tanner Maurer | IL | Crystal Lake South | 2027 | OF | 30.1 g |
| 9 | Makai Johnson | NV | Douglas | 2028 | 1B | 29.9 g |
| 10 | Kannon Almond | WA | Lakeside | 2027 | 2B | 29.8 g |
| 11 | Josh Bernard | PA | Bishop McDevitt | 2028 | SS | 29.6 g |
| 12 | Cullen Millner | VA | Jefferson Forest | 2027 | LHP | 29.3 g |
| 13 | Parker Daugherty | IN | Huntington North | 2027 | OF | 29.0 g |
| 14 | Ben Herbein | PA | Malvern Prep | 2029 | 2B | 28.8 g |
| 15 | Jack Krawchuk | PA | Archbishop Wood | 2029 | 3B | 28.6 g |
Body Rotation: A swing that has the appropriate relative contributions of body and bat rotations is an efficient and Powerful swing that maintains proper sequencing. An efficient baseball swing is one in which the body creates the initial movements, which is then transferred to the arms and out to the bat, thereby maximizing Bat Speed through this proximal-to-distal kinematic sequencing movement pattern.
(Chase Mitcheltree; 2/14/26)
VIZUAL EDGE LEADERS
EDGE SCORE
| Rank | Name | State | School | Class | Pos | Edge Score |
| 1 | Ethan Gonzalez | IL | Fenwick | 2027 | C | 89.74 |
| 2 | Cameron Klene | IL | Providence Catholic | 2027 | SS | 88.81 |
| 3 | Logan Allen | WA | Archbishop Murphy | 2028 | 3B | 88.56 |
| 4 | Braedon Paczocha | WI | Mukwonago | 2028 | C | 88.47 |
| 5 | Ryan Harris | NJ | Boonton | 2029 | 2B | 88.12 |
| 6 | Casey French | WA | Chiawana | 2028 | RHP | 87.99 |
| 7 | Austin Hartnett | ID | Rocky Mountain | 2026 | OF | 87.81 |
| 8 | Hayden Hocker | KS | Andover Central | 2027 | OF | 87.01 |
| 9 | Ty McGough | PA | Hollidaysburg Area | 2028 | SS | 86.83 |
| 10 | Samuel James | IL | Chicago Hope Academy | 2028 | OF | 86.69 |
| ^ | Jaxton Kostman | WI | Badger | 2027 | 2B | 86.69 |
The Edge Score is a comprehensive score out of 100 that takes the core-six visual skills into account, providing athletes, parents, coaches and scouts with a benchmark number for assessing an athlete’s overall visual ability. In general the higher the Edge Score, the higher chance of athletic success. Think of the Edge Score as the 'Sixth Metric' in the standard Five-Tools that make up a ball player.
The average Edge Score for the 2020 MLB Draft Class was 79.3 (of hitters who completed a Vizual Edge test). MLB players we've worked with typically show stronger scores, with elite hitters scoring consistently above 87.0 on their Edge Score.
(Cameron Klene; 2/16/26)
TRACKMAN PITCHING LEADERS
FASTBALL
VELOCITY (MAX)
| Rank | Name | State | School | Class | Pos | Velocity (max) | Spin Rate (avg) | Spin Efficiency % (avg) |
| 1 | Evan Loftis | MO | Liberty North | 2027 | RHP | 94.1 mph | 1975 rpm | 92 % |
| 2 | Zayden Peltz | AZ | EVIT-Chandler | 2027 | OF | 92.7 mph | 2424 rpm | 79 % |
| 3 | Mason Cevette | PA | Cedar Crest | 2028 | RHP | 92.6 mph | 2400 rpm | 90 % |
| 4 | Aaron Gaskey | PA | Greater Latrobe | 2028 | RHP | 92.1 mph | 2303 rpm | 80 % |
| 5 | Quinn Birdsong | AR | Shiloh Christian | 2028 | RHP | 92.1 mph | 2443 rpm | 77 % |
| 6 | Dominic Maloney | IL | Loyola Academy | 2027 | RHP | 92.1 mph | 2123 rpm | 89 % |
| 7 | Jayden Davis | VA | Amherst County | 2026 | OF | 92.0 mph | 2378 rpm | 82 % |
| 8 | Christian King | PA | Chartiers Valley | 2028 | RHP | 91.8 mph | 2397 rpm | 85 % |
| 9 | Ben Hinderberger | PA | Council Rock North | 2028 | RHP | 91.5 mph | 2126 rpm | 86 % |
| 10 | Vincent Leoni | PA | Bishop McDevitt | 2028 | LHP | 91.2 mph | 2219 rpm | 92 % |
| 11 | Kade Wede | SD | Harrisburg | 2027 | RHP | 91.1 mph | 2239 rpm | 78 % |
| 12 | Brooks Robinson | AR | Greene County Tech | 2028 | RHP | 91.1 mph | 1727 rpm | 94 % |
| 13 | Tyson Resch | WI | Menomonee Falls | 2028 | RHP | 91.1 mph | 2268 rpm | 78 % |
| 14 | Parker Bass | KS | Olathe West | 2028 | RHP | 91.0 mph | 2399 rpm | 81 % |
| 15 | Stephen Starnes | UT | Bear River | 2026 | RHP | 90.9 mph | 2159 rpm | 90 % |
(Brooks Robinson; 2/7/26)
HIGHEST SPIN RATE (AVG.)
| Rank | Name | State | School | Class | Pos | Spin Rate (avg) | Velo Range | Spin Efficiency % (avg) |
| 1 | Jonah Mull | KS | Bishop Carroll | 2027 | SS | 2648 rpm | 83.2-88.6 mph | 62 % |
| 2 | Carson Wilms | WA | Mount Vernon | 2029 | RHP | 2567 rpm | 79.7-81.2 mph | 63 % |
| 3 | Sean McDaniels | AZ | Liberty | 2027 | RHP | 2498 rpm | 84.7-86.0 mph | 58 % |
| 4 | Ian Crabb | IL | Harrisburg | 2027 | SS | 2485 rpm | 84.3-85.7 mph | 94 % |
| 5 | Nate Larson | IL | Huntley | 2027 | LHP | 2474 rpm | 85.2-86.7 mph | 93 % |
| 6 | Albertino Pozzo | WA | Mercer Island | 2028 | OF | 2464 rpm | 85.6-87.9 mph | 86 % |
| 7 | Jack Boerst | WI | Arrowhead | 2027 | RHP | 2455 rpm | 82.3-83.6 mph | 52 % |
| 8 | Quinn Birdsong | AR | Shiloh Christian | 2028 | RHP | 2443 rpm | 89.9-91.8 mph | 77 % |
| 9 | Zachary Lehman | PA | Bellefonte Area | 2027 | RHP | 2441 rpm | 88.2-89.0 mph | 72 % |
| 10 | Ethan Flavel | WA | Decatur | 2027 | 3B | 2435 rpm | 87.0-88.8 mph | 71 % |
| 11 | Jimmy Clark | PA | Council Rock South | 2028 | RHP | 2430 rpm | 85.7-87.0 mph | 75 % |
| 12 | Zayden Peltz | AZ | EVIT-Chandler | 2027 | OF | 2424 rpm | 91.7-92.7 mph | 79 % |
| 13 | Cam Sanabria | IL | Jacobs | 2028 | 3B | 2422 rpm | 81.7-84.0 mph | 48 % |
| 14 | Greyson Garza | WA | Steilacoom | 2029 | SS | 2411 rpm | 83.4-84.3 mph | 72 % |
| 15 | Braden Jones | NV | Reno | 2027 | SS | 2403 rpm | 87.8-88.9 mph | 77 % |
Max Fastball Velocity: This metric calculates the speed of the pitch as it’s released from the pitcher’s hand.
Average Spin Rate: This metric calculates the rate of spin on the baseball as it leaves the pitcher’s hand, measured in revolutions per minute (rpm). Historical data shows that high-spin fastballs lessen the impact of gravity, allowing for more ‘rise’ (or less fall, in other words) as it carries through the zone. Low-spin fastballs typically indicate the pitch has greater horizontal action, often making it tougher to square up, but generally easier to make contact with, leading to more ground balls, while high-spin fastballs show a correlation with swings and misses.
(Ian Crabb; 2/16/26)
HIGHEST INDUCED VERTICAL BREAK (AVG.)
| Rank | Name | State | School | Class | Pos | IVB (avg) | Velo Range | Spin Rate (avg) |
| 1 | Colin Swing | NY | Webster Thomas | 2028 | RHP | 25.8 in | 77.1-78.7 mph | 2138 rpm |
| 2 | Peyton Yetter | IL | Washington | 2028 | 3B | 24.2 in | 73.4-74.9 mph | 1917 rpm |
| 3 | Deegan Gonzalez | ID | Mountain View | 2027 | OF | 24.0 in | 75.5-77.1 mph | 1948 rpm |
| 4 | Josh Goodin | KY | Pulaski County | 2030 | 3B | 23.8 in | 59.6-61.0 mph | 1566 rpm |
| 5 | Tysen Deaton | NY | Northstar Christian Academy | 2027 | RHP | 23.6 in | 82.2-83.2 mph | 2071 rpm |
| 6 | Jack Tackett | WA | Hudson's Bay | 2028 | LHP | 23.4 in | 81.1-82.9 mph | 2369 rpm |
| 7 | River Knepp | PA | Midd-West | 2029 | OF | 23.1 in | 75.9-77.7 mph | 1994 rpm |
| 8 | Hiroto Kadobayashi | WA | Ballard | 2028 | SS | 22.9 in | 75.7-77.1 mph | 1910 rpm |
| 9 | Jace Abe | WA | Bonney Lake | 2029 | C | 22.9 in | 80.3-82.6 mph | 1868 rpm |
| 10 | Lucas Genareo | NY | Southwestern Central | 2028 | RHP | 22.7 in | 88.1-89.4 mph | 2211 rpm |
| 11 | Antonio Britton | IL | Homewood-Flossmoor | 2029 | RHP | 22.7 in | 78.9-81.6 mph | 1940 rpm |
| 12 | Ryder Froman | NY | Eastridge | 2027 | RHP | 22.6 in | 85.4-86.3 mph | 2305 rpm |
| 13 | Robert Isaacson | AZ | CTD-Buena | 2027 | OF | 22.6 in | 79.9-81.7 mph | 1897 rpm |
| 14 | Mckade Griese | IN | Terre Haute South | 2028 | SS | 22.5 in | 78.0-81.3 mph | 2103 rpm |
| 15 | Colin Albano | IL | Wauconda | 2027 | OF | 22.4 in | 77.2-80.3 mph | 2192 rpm |
Induced Vertical Break: Used in short form as "IVB," this metric is most important on fastballs for creating rise and on curveballs for creating depth – it can also have some use when measuring sliders and cutters as well. Sliders tend to be closer to zero inches while cutters are generally between 5 and 15 inches. Usually fastballs and curveballs with large IVB have higher spin efficiencies as well. Sliders generally have very little (closer to zero) IVB and very low spin efficiency. You could also categorize IVB into spin rate as this is part of the “useful movement” you’re looking for. IVB is also a huge part of the vertical approach angle.

(Nate Larson; 2/14/26)
HIGHEST HORIZONTAL BREAK (AVG.)
| Rank | Name | State | School | Class | Pos | HM (avg) | Velo Range | Spin Rate (avg) |
| 1 | Matthew Breer | MO | Lee's Summit | 2029 | OF | -22.0 | 75.0-78.5 mph | 2216 rpm |
| 2 | Connor Flynn | NY | Wellington C. Mepham | 2027 | 1B | 21.0 | 74.5-76.3 mph | 1870 rpm |
| 3 | Alexander Mote | IL | Morris | 2028 | RHP | 20.3 | 78.0-79.6 mph | 1929 rpm |
| 4 | Shae LaBlance | VA | Greenbrier Christian Academy | 2028 | SS | 20.2 | 79.2-80.6 mph | 1874 rpm |
| 5 | Joel Weaver | PA | Lampeter-Strasburg | 2027 | RHP | 20.0 | 83.3-84.4 mph | 1826 rpm |
| 6 | Marshall Guyer | WA | Northwest Christian | 2028 | RHP | 19.6 | 83.2-86.1 mph | 2332 rpm |
| 7 | Carter Eriks | IN | Crown Point | 2028 | RHP | 19.5 | 79.8-81.6 mph | 2063 rpm |
| 8 | Andrew Stelle | WA | Lewis & Clark | 2027 | 1B | 19.3 | 71.2-72.7 mph | 1795 rpm |
| 9 | Logan Banowski | IN | Lake Central | 2027 | 2B | 19.3 | 79.7-80.4 mph | 1975 rpm |
| 10 | Lee Wright | PA | State College Area | 2028 | SS | 19.3 | 77.8-79.4 mph | 2008 rpm |
| 11 | Ethan Thompson | NY | Clayton A. Bouton | 2029 | 1B | 19.3 | 74.9-75.8 mph | 1734 rpm |
| 12 | Cross Morgan | AR | West Memphis Christian | 2030 | 1B | 19.2 | 77.5-78.3 mph | 2106 rpm |
| 13 | Jack Klump | MO | Jefferson (Festus) | 2028 | RHP | 19.1 | 80.3-81.8 mph | 2018 rpm |
| 14 | Asher Kauppinen | IL | Dunlap | 2028 | RHP | 19.1 | 73.2-74.1 mph | 1693 rpm |
| 15 | Gavin Dozier | AR | Fayetteville East | 2029 | OF | 19.0 | 74.3-75.3 mph | 1855 rpm |
Horizontal Break: Outlined on TrackMan’s own website: “... horizontal movement is measured in inches between where the pitch actually crosses the front of home plate side-wise, and where it would have crossed home plate side-wise if had it traveled in a perfectly straight line from release. A positive number means the break was to the right from the pitcher’s perspective, while a negative number means the break was to the left from the pitcher’s perspective.”
(Shae LaBlance; 2/16/26)
BREAKING BALL
SPIN RATE (AVG.)
| Rank | Name | State | School | Class | Pos | BB | Velo Range | Velo Range |
| 1 | Trevor Schlosser | SD | Stevens | 2027 | 1B | 2976 | 68.0-69.5 mph | 71.6-73.7 mph |
| 2 | Will Evert | MO | Raymore-Peculiar | 2028 | RHP | 2945 | 72.3-75.8 mph | 74.5-75.6 mph |
| 3 | Robby Seifert | IL | Fremd | 2027 | LHP | 2915 | 68.7-69.6 mph | 71.3-73.8 mph |
| 4 | Braden Jones | NV | Reno | 2027 | SS | 2813 | - | 72.3-75.0 mph |
| 5 | Bryson Prussman | SD | Tea Area | 2027 | RHP | 2752 | - | 73.6-75.1 mph |
| 6 | Tate Johnson | SD | Sturgis Brown | 2029 | SS | 2733 | 69.3-72.3 mph | 72.8-74.3 mph |
| 7 | Albertino Pozzo | WA | Mercer Island | 2028 | OF | 2721 | 66.8-69.1 mph | 73.2-74.9 mph |
| 8 | Carson Lysaght | WI | Elkhorn | 2027 | RHP | 2719 | 72.8-75.3 mph | 73.7-74.6 mph |
| 9 | Blake Vriesen | MN | Chaska | 2027 | RHP | 2714 | 73.9-75.4 mph | 74.7-75.6 mph |
| 10 | Cade Heiman | WI | Oshkosh West | 2027 | RHP | 2707 | - | 75.3-76.7 mph |
| 11 | Creed Price | KY | LaRue County High School | 2027 | RHP | 2705 | 70.8-72.1 mph | 73.4-74.2 mph |
| 12 | Kayden Jones | KY | St. Xavier | 2027 | RHP | 2645 | 68.1-69.1 mph | - |
| 13 | Wyatt Hansen | KS | Olathe South | 2028 | RHP | 2645 | - | 68.1-70.1 mph |
| 14 | Jonah Mull | KS | Bishop Carroll | 2027 | SS | 2641 | - | 75.4-77.0 mph |
| 15 | Ethan Flavel | WA | Decatur | 2027 | 3B | 2638 | 75.2-78.6 mph | - |
(Will Evert; 2/14/26)
INDUCED VERTICAL BREAK (AVG.)
| Rank | Name | State | School | Class | Pos | BB | Velo Range | Velo Range |
| 1 | Owen Norton | IN | Blackford | 2028 | SS | -20.8 in | 68.2-69.4 mph | 68.3-69.7 mph |
| 2 | Kade Theobald | IA | Johnston Senior | 2028 | LHP | -19.5 in | 66.2-67.3 mph | 67.9-70.1 mph |
| 3 | Carlo Woellner-Davis | PA | Conrad Weiser | 2028 | C | -18.0 in | 70.4-71.3 mph | 75.3-75.8 mph |
| 4 | Hiroto Kadobayashi | WA | Ballard | 2028 | SS | -17.8 in | 63.1-63.7 mph | - |
| 5 | Creed Price | KY | LaRue County High School | 2027 | RHP | -17.4 in | 70.8-72.1 mph | 73.4-74.2 mph |
| 6 | Mahlon Foster | MO | Sullivan | 2027 | RHP | -17.4 in | 64.6-65.9 mph | 69.7-71.0 mph |
| 7 | Carson Hollon | IN | Warsaw Community | 2029 | OF | 17.2 in | - | 68.8-70.0 mph |
| 8 | Gavin Gross | PA | Pope John Paul II | 2027 | OF | -16.5 in | 69.5-70.4 mph | - |
| 9 | Carter Eriks | IN | Crown Point | 2028 | RHP | -16.5 in | 68.5-69.8 mph | 69.7-71.6 mph |
| 10 | Lincoln Yott | IL | Lincoln-Way East | 2028 | RHP | -16.4 in | 67.3-68.7 mph | - |
(Creed Price; 2/8/26)
HORIZONTAL BREAK (AVG.)
| Rank | Name | State | School | Class | Pos | BB | Velo Range | Velo Range |
| 1 | James Collier | OR | Silverton | 2027 | RHP | -24.0 | 68.6-72.2 mph | 72.7-75.5 mph |
| 2 | Ben Sheets | ND | Fargo North | 2027 | RHP | -23.2 | 66.4-67.4 mph | 66.0-71.1 mph |
| 3 | Drake Weatherholt | IN | Concord Community | 2028 | SS | -22.0 | 65.4-66.2 mph | 64.2-65.8 mph |
| 4 | Landynn Bieber | PA | Lewisburg | 2028 | RHP | -21.9 | 66.0-66.6 mph | - |
| 5 | Brayden Leider | WI | Arrowhead | 2028 | OF | -21.8 | - | 66.3-69.4 mph |
| 6 | Wyatt Hansen | KS | Olathe South | 2028 | RHP | -21.6 | - | 68.1-70.1 mph |
| 7 | Cody Mills | NY | Saratoga Springs | 2028 | 3B | -21.6 | - | 67.6-74.7 mph |
| 8 | Tino DiFranco | MO | Rockwood Summit | 2027 | 2B | -21.4 | 65.1-67.1 mph | - |
| 9 | Trevor Schlosser | SD | Stevens | 2027 | 1B | -21.4 | 68.0-69.5 mph | 71.6-73.7 mph |
| 10 | Connor Peterson | NV | Albert M. Lowry | 2026 | RHP | -21.4 | - | 68.9-70.2 mph |
(Wyatt Hansen; 2/14/26)
CHANGEUP
SPIN RATE (AVG.)
| Rank | Name | State | School | Class | Pos | Spin Rate (avg) | Velo Range |
| 1 | Sean McDaniels | AZ | Liberty | 2027 | RHP | 2260 rpm | 77.8-79.0 mph |
| 2 | Will Turba | WA | Mercer Island | 2026 | RHP | 2255 rpm | 72.6-74.8 mph |
| 3 | Sean McKendrick | IL | Notre Dame College Prep | 2029 | SS | 2252 rpm | 71.7-72.6 mph |
| 4 | Liam Darst | WI | Catholic Memorial | 2029 | OF | 2217 rpm | 74.6-76.0 mph |
| 5 | Max Warner | IN | Homestead Senior | 2027 | RHP | 2214 rpm | 71.4-73.0 mph |
| 6 | Carson Wilms | WA | Mount Vernon | 2029 | RHP | 2176 rpm | 77.9-80.0 mph |
| 7 | Jackson Hadley | TN | Arlington | 2028 | RHP | 2164 rpm | 77.8-78.0 mph |
| 8 | Peyson Summers | UT | Cottonwood | 2027 | RHP | 2161 rpm | 75.3-78.9 mph |
| 9 | Landon Sotosky | VA | Charles J. Colgan | 2028 | SS | 2128 rpm | 71.7-72.6 mph |
| 10 | Jenner Smith | IL | Hersey | 2028 | OF | 2128 rpm | 77.7-80.1 mph |
INDUCED VERTICAL BREAK (AVG.)
| Rank | Name | State | School | Class | Pos | IVB (avg) | Velo Range |
| 1 | Brenton Trickey | IL | Williamsville | 2028 | LHP | 22.0 in | 72.5-74.2 mph |
| 2 | Bryce Butler | PA | Thomas Jefferson | 2027 | OF | 21.1 in | 72.5-74.8 mph |
| 3 | Evan Burch | WI | New Berlin West | 2029 | OF | 20.5 in | 72.2-77.8 mph |
| 4 | Barrett Mallett | AR | Valley View | 2028 | SS | 20.2 in | 75.0-77.0 mph |
| 5 | Lucas Fisher | VA | Trinity Christian | 2027 | RHP | 20.0 in | 74.6-75.8 mph |
| 6 | Christopher (Reese) Wilbur | IN | West Vigo | 2028 | RHP | 19.9 in | 73.6-73.7 mph |
| 7 | Devon Hester | IL | Brooks College Prep | 2029 | 3B | 19.8 in | 68.3-73.3 mph |
| 8 | Mitchell Reid | KY | Marshall County | 2027 | LHP | 19.7 in | 69.1-72.5 mph |
| 9 | Aidan Francisco | NY | Chester Academy | 2027 | LHP | 19.5 in | 72.3-72.9 mph |
| 10 | Lee Eckstein | DC | Jackson-Reed | 2027 | C | 19.4 in | 73.8-74.7 mph |
(Lucas Fisher; 2/7/26)
HORIZONTAL BREAK (AVG.)
| Rank | Name | State | School | Class | Pos | HM (avg) | Velo Range |
| 1 | Ethan Thompson | NY | Clayton A. Bouton | 2029 | 1B | 23.9 | 69.7-70.7 mph |
| 2 | Alex Petersen | IA | Davenport North | 2029 | SS | 21.4 | 64.9-66.3 mph |
| 3 | Colton Miller | IL | Wheaton Academy | 2027 | RHP | 21.3 | 75.9-76.9 mph |
| 4 | Chase Slotcavage | PA | North Schuylkill | 2028 | RHP | 21.1 | 76.8-77.9 mph |
| 5 | Christian Walania | IL | Lyons Township | 2027 | RHP | 21.1 | 80.1-81.4 mph |
| 6 | Drew Stettbacher | WI | Horace Mann | 2027 | LHP | -21.0 | 73.7-75.6 mph |
| 7 | Austin Webb | MN | Rogers | 2028 | 3B | 20.8 | 71.0-72.9 mph |
| 8 | Drake Weatherholt | IN | Concord Community | 2028 | SS | 20.7 | 71.6-72.2 mph |
| 9 | Charlie Mausser | IA | Davenport Assumption | 2029 | SS | 20.5 | 74.7-76.4 mph |
| 10 | Abdel Yarala | KS | Life Preparatory Academy | 2027 | RHP | 20.3 | 78.9-79.6 mph |
(Christian Walania; 2/16/26)
RELATED CONTENT