The Winter Pulse: Weeks 2 & 3
January 20, 2026

Throughout this winter showcase season, we’ll be taking the time to put into perspective the highlight-worthy performances that elevate prospects from our open Preseason ID events into need-to-know prospects within their regions or even the entire nation.
So, in this series, we’ll be spending some time highlighting the prospects who participated in recent Preseason ID events and performed like some of the best players in their backyards.
UPCOMING PRESEASON ID EVENTS
| Date | Event | Location |
| Saturday, Jan. 24 | Knoxville PID | Knoxville, TN |
| Saturday, Jan. 24 | Asheville PID | Asheville, NC |
| Sunday, Jan. 25 | Northern Arizona PID | Flagstaff, AZ |
| Sunday, Jan. 25 | Charlotte PID | Charlotte, NC |
| Sunday, Jan. 25 | Maryland PID | Columbia, MD |
| Sunday, Jan. 25 | Inland Empire PID | Corona, CA |
Find more upcoming Prep Baseball events here.
The leaderboards below contain statistics from 18 Preseason ID-branded showcases that took place between Jan. 10-19 in Arizona, California, Georgia, Illinois, Louisiana, Mississippi, Oklahoma, South Carolina, Tennessee, and Texas.
TOP 60-YARD DASH
| Rank | Name | State | School | Class | Pos | 60-yd. |
| 1 | Brayden Slorahn | GA | Pope | 2027 | OF | 6.65 |
| 2 | Asher Bunnin | CA | Harvard-Westlake | 2027 | OF | 6.70 |
| 3 | Cooper Lunsford | CA | Bear River High | 2027 | SS | 6.72 |
| 4 | Wyatt Jones | TN | Christian Academy of Knoxville | 2028 | OF | 6.76 |
| 5 | Xavier Thompson | MS | West Lauderdale | 2027 | OF | 6.79 |
TRACKMAN HITTING LEADERS
EXIT VELOCITY (MAX)
| Rank | Name | State | School | Class | Pos | Exit Velocity (max) | Sweet Spot % |
| 1 | Kenny Estes | TX | Homeschool | 2028 | C | 109.1 mph | 75 % |
| 2 | Mason Newhouse | CA | Oak Ridge High | 2027 | 1B | 106.8 mph | 77 % |
| 3 | Logan Crawford | OK | Charles Page | 2028 | 1B | 105.9 mph | - |
| 4 | Kyas Howard | CA | Sierra Canyon School | 2027 | 1B | 104.5 mph | 83 % |
| 5 | Pierce OBrien | CA | Bishop Montgomery High | 2028 | 1B | 104.0 mph | 40 % |
| 6 | Carson Caras | CA | Harvard-Westlake | 2027 | OF | 103.3 mph | 60 % |
| 7 | Zack Peura | AZ | Salpointe | 2027 | 3B | 103.3 mph | 58 % |
| 8 | Yaxel Ledezma | AZ | Catalina Foothills | 2026 | 3B | 103.2 mph | 40 % |
| 9 | Spencer Norman | GA | Woodward | 2028 | OF | 103.2 mph | 58 % |
| 10 | William Resutek | GA | Oconee County | 2027 | RHP | 103.1 mph | 62 % |
EXIT VELOCITY (AVG.)
| Rank | Name | State | School | Class | Pos | Exit Velocity (avg) | Sweet Spot % |
| 1 | Kenny Estes | TX | Homeschool | 2028 | C | 104.7 mph | 75 % |
| 2 | Mason Newhouse | CA | Oak Ridge High | 2027 | 1B | 101.3 mph | 77 % |
| 3 | Evan Jenks | IL | Minooka | 2027 | SS | 98.4 mph | 71 % |
| 4 | Bradley Hastings | OK | Bishop Kelley | 2028 | SS | 97.2 mph | 90 % |
| 5 | Logan Crawford | OK | Charles Page | 2028 | 1B | 96.4 mph | - |
| 6 | Eli Herring | MS | Greene County | 2027 | 1B | 95.8 mph | 85 % |
| 7 | Joshua Wesby | IL | Oswego East | 2027 | 1B | 95.7 mph | 42 % |
| 8 | Waylon Marko | IL | Hononegah | 2028 | C | 95.1 mph | 70 % |
| 9 | Ethan Oldfield | TX | Rockwall-Heath | 2028 | 1B | 94.9 mph | 66 % |
| 10 | Yaxel Ledezma | AZ | Catalina Foothills | 2026 | 3B | 94.7 mph | 40 % |
Exit Velocity: This metric measures the speed of the ball, measured in miles per hour, as it comes off the bat at the moment of contact.
Sweet Spot percentage: This metric is determined by how often the player produces a batted ball during the session with a launch angle between 8 to 32 degrees.
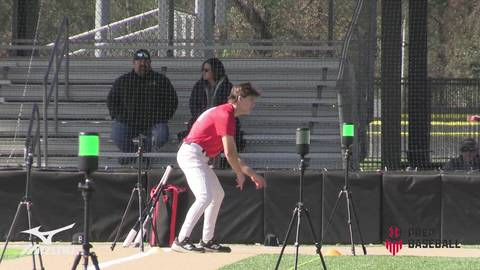
2028 C/1B Kenny Estes@KennyJEstes44 | Homeschool
— Prep Baseball Texas (@PrepBaseball_TX) January 14, 2026
Max Exit Velo: 109.1‼️
Max Distance: 429’
The 6’2 220 Soph. showed some big time 🧃potential in our first look at the Central Texas Preseason ID.
Posted the top EV of the day and deposited multiple balls over 400’ during… pic.twitter.com/rVL9oZF8Wo
BLAST MOTION LEADERS
BAT SPEED (AVG.)
| Rank | Name | State | School | Class | Pos | Bat Speed (avg) | On Plane Eff (avg) |
| 1 | Ryder Campbell | AZ | Sabino | 2026 | C | 79.0 mph | 45 % |
| 2 | Roland Mose | CA | St. Monica Prep | 2027 | OF | 78.4 mph | 49 % |
| 3 | Layne James | AZ | Santa Cruz Valley | 2029 | RHP | 77.8 mph | 49 % |
| 4 | Joshua Wesby | IL | Oswego East | 2027 | 1B | 77.5 mph | 48 % |
| 5 | Evan Jenks | IL | Minooka | 2027 | SS | 77.2 mph | 59 % |
| 6 | Keller Bradley | MS | St. Aloysius | 2027 | OF | 77.1 mph | 59 % |
| 7 | Spencer Norman | GA | Woodward | 2028 | OF | 77.0 mph | 48 % |
| 8 | Eli Primm | GA | Jefferson | 2027 | OF | 76.9 mph | 56 % |
| 9 | Josiah Harris | GA | Academy For Classical Education | 2027 | OF | 76.0 mph | 61 % |
| 10 | Josue Javier-Martinez | AZ | Sahuarita | 2026 | 1B | 76.0 mph | 51 % |
Bat Speed: The observed speed of the sweet spot of the bat at impact. The sweet spot of the bat is measured six inches from the tip of the bat.
ROTATIONAL ACCELERATION (AVG.)
| Rank | Name | State | School | Class | Pos | Rot. Acc (avg) | On Plane Eff (avg) |
| 1 | Spencer Norman | GA | Woodward | 2028 | OF | 30.2 g | 48 % |
| 2 | Nicolas Valencia | CA | Simi Valley High | 2027 | OF | 29.4 g | 70 % |
| 3 | Mason Seyller | IL | Benet Academy | 2028 | OF | 29.3 g | 57 % |
| 4 | Johan Esmill Martinez | AZ | Salpointe Catholic School | 2028 | SS | 28.2 g | 57 % |
| 5 | Matthew Pecha | CA | Vista del Lago High | 2028 | 3B | 28.2 g | 77 % |
| 6 | Giuseppe Bianchi | CA | Chico High | 2027 | C | 27.0 g | 80 % |
| 7 | Carter Bourque | LA | Teurlings Catholic | 2028 | OF | 27.0 g | 83 % |
| 8 | Matthew Kemp | TX | Comfort | 2027 | OF | 26.6 g | 49 % |
| 9 | Josiah Harris | GA | Academy For Classical Education | 2027 | OF | 26.3 g | 61 % |
| 10 | Hudson Stringer | GA | Rabun Gap Nacoochee School | 2027 | OF | 25.8 g | 63 % |
Body Rotation: A swing that has the appropriate relative contributions of body and bat rotations is an efficient and Powerful swing that maintains proper sequencing. An efficient baseball swing is one in which the body creates the initial movements, which is then transferred to the arms and out to the bat, thereby maximizing Bat Speed through this proximal-to-distal kinematic sequencing movement pattern.
(Carter Bourque; 1/15/26)
VIZUAL EDGE LEADERS
EDGE SCORE
| Rank | Name | State | School | Class | Pos | Edge Score |
| 1 | Logan Tylke | GA | Harrison | 2029 | 2B | 90.50 |
| 2 | Benjamin Balliet | SC | Fox Creek | 2028 | OF | 86.48 |
| 3 | Brodie Singletary | GA | Fitzgerald | 2027 | C | 84.91 |
| 4 | Samik Raina | GA | Kennesaw Mountain | 2028 | C | 84.65 |
| 5 | Pace Segraves | OK | Metro Christian | 2029 | C | 83.65 |
| 6 | Dyson Sparks | GA | Etowah | 2029 | OF | 83.41 |
| 7 | Ryan Ruby | TN | Pope John Paul II | 2028 | SS | 83.38 |
| 8 | Mason Newhouse | CA | Oak Ridge High | 2027 | 1B | 83.27 |
| 9 | Eli Weinberger | CA | Carlmont High | 2027 | OF | 83.14 |
| 10 | Keaton Westbrook | GA | Athens Christian | 2026 | SS | 83.03 |
The Edge Score is a comprehensive score out of 100 that takes the core-six visual skills into account, providing athletes, parents, coaches and scouts with a benchmark number for assessing an athlete’s overall visual ability. In general the higher the Edge Score, the higher chance of athletic success. Think of the Edge Score as the 'Sixth Metric' in the standard Five-Tools that make up a ball player.
The average Edge Score for the 2020 MLB Draft Class was 79.3 (of hitters who completed a Vizual Edge test). MLB players we've worked with typically show stronger scores, with elite hitters scoring consistently above 87.0 on their Edge Score.
TRACKMAN PITCHING LEADERS
FASTBALL
VELOCITY (MAX)
| Rank | Name | State | School | Class | Pos | Velocity (max) | Spin Rate (avg) | Spin Efficiency % (avg) |
| 1 | Parker Biltimier | AZ | Basha | 2027 | RHP | 92.2 mph | 2348 rpm | 83 % |
| 2 | Nathan Sprankle | LA | Benton | 2027 | RHP | 88.2 mph | 2158 rpm | 73 % |
| 3 | Logan Crawford | OK | Charles Page | 2028 | 1B | 88.2 mph | 2490 rpm | 59 % |
| 4 | Osvaldo Nunez | CA | Bishop Alemany | 2026 | RHP | 88.0 mph | 2200 rpm | 87 % |
| 5 | Will Oliver | LA | Saint Paul's | 2027 | RHP | 87.7 mph | 2114 rpm | 90 % |
| 6 | Ory Titus | LA | Jewel M. Sumner | 2027 | RHP | 87.6 mph | 2172 rpm | 88 % |
| 7 | William Resutek | GA | Oconee County | 2027 | RHP | 87.5 mph | 2327 rpm | 85 % |
| 8 | Matthew Coye | CA | Redondo Union High | 2028 | RHP | 87.1 mph | 2167 rpm | 98 % |
| 9 | Zachary Westerberg | IL | Lincoln-Way East | 2027 | RHP | 86.9 mph | 2008 rpm | 70 % |
| 10 | Zak Perry | SC | Gray Collegiate Academy | 2027 | RHP | 86.6 mph | 2146 rpm | 81 % |
HIGHEST SPIN RATE (AVG.)
| Rank | Name | State | School | Class | Pos | Spin Rate (avg) | Velo Range | Spin Efficiency % (avg) |
| 1 | Logan Crawford | OK | Charles Page | 2028 | 1B | 2490 rpm | 86.4-87.6 mph | 59 % |
| 2 | Michael Queen | GA | Blessed Trinity Catholic | 2029 | OF | 2477 rpm | 77.3-78.5 mph | 95 % |
| 3 | Peyton Landry | DO | West Feliciana | 2027 | SS | 2354 rpm | 82.3-83.5 mph | 78 % |
| 4 | Lucas Clark | GA | Woodward Academy | 2027 | RHP | 2350 rpm | 81.5-82.5 mph | 53 % |
| 5 | Parker Biltimier | AZ | Basha | 2027 | RHP | 2348 rpm | 89.2-91.4 mph | 83 % |
| 6 | Grady Hammer | MS | Pisgah | 2027 | 1B | 2329 rpm | 77.7-79.5 mph | 73 % |
| 7 | William Resutek | GA | Oconee County | 2027 | RHP | 2327 rpm | 84.2-87.5 mph | 85 % |
| 8 | Justin Herd | GA | Etowah | 2028 | 3B | 2313 rpm | 75.8-77.3 mph | 41 % |
| 9 | Anthony Sauceda | TX | Sonia Sotomayor | 2027 | 2B | 2300 rpm | 75.1-76.0 mph | - |
| 10 | Tanner Conley | LA | Fontainebleau | 2028 | LHP | 2295 rpm | 83.5-85.0 mph | 74 % |
Max Fastball Velocity: This metric calculates the speed of the pitch as it’s released from the pitcher’s hand.
Average Spin Rate: This metric calculates the rate of spin on the baseball as it leaves the pitcher’s hand, measured in revolutions per minute (rpm). Historical data shows that high-spin fastballs lessen the impact of gravity, allowing for more ‘rise’ (or less fall, in other words) as it carries through the zone. Low-spin fastballs typically indicate the pitch has greater horizontal action, often making it tougher to square up, but generally easier to make contact with, leading to more ground balls, while high-spin fastballs show a correlation with swings and misses.
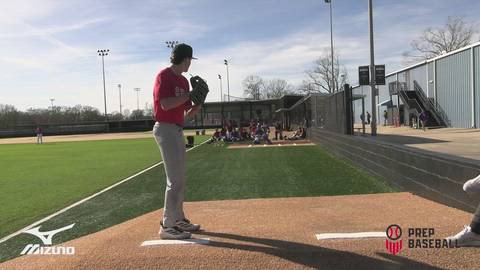
𝗘𝗮𝘀𝘁 𝗩𝗮𝗹𝗹𝗲𝘆 𝗣𝗜𝗗 🏜️
— Prep Baseball Arizona (@PrepBaseballAZ) January 20, 2026
Parker Biltimier | 2027 RHP | Basha (AZ)
• FB 89–91 T92 with late life
• Avg 2348 rpm, T2457
• SL 76–77 with sharp action, bat miss pitch
• CB 71–75 for strikes
• CH 81–82 with fade
Loose 3/4 arm, effortless mover, and shows confidence… pic.twitter.com/96kF2I8czj
HIGHEST INDUCED VERTICAL BREAK (AVG.)
| Rank | Name | State | School | Class | Pos | IVB (avg) | Velo Range | Spin Rate (avg) |
| 1 | Jake Skelton | TN | Grace Christian Academy | 2028 | 1B | 21.5 in | 79.0-80.0 mph | 2016 rpm |
| 2 | Mason Madrid | AZ | Crismon | 2028 | OF | 21.2 in | 69.3-72.2 mph | 1742 rpm |
| 3 | Carter Smith | GA | Harlem | 2029 | 3B | 21.2 in | 74.6-76.6 mph | 1884 rpm |
| 4 | Dakota Coleman | TX | Dallas Christian | 2027 | LHP | 20.8 in | 75.9-77.1 mph | 1990 rpm |
| 5 | James Tyler | CA | St. Bernard's | 2028 | OF | 20.8 in | 73.8-75.8 mph | 1948 rpm |
| 6 | Kameron Roller | LA | Pineville | 2027 | 2B | 20.7 in | 79.3-80.7 mph | 1935 rpm |
| 7 | Wyatt Young | CA | Sierra High | 2028 | RHP | 20.0 in | 80.5-81.8 mph | 2056 rpm |
| 8 | Logan White | TX | Leander | 2028 | RHP | 19.7 in | 78.8-81.5 mph | 2009 rpm |
| 9 | Colin Ogden | IL | Plainfield North | 2027 | C | 19.7 in | 82.8-85.7 mph | 2175 rpm |
| 10 | Reid Robinson | TX | Long Creek | 2029 | 1B | 19.4 in | 73.4-74.7 mph | 1791 rpm |
Induced Vertical Break: Used in short form as "IVB," this metric is most important on fastballs for creating rise and on curveballs for creating depth – it can also have some use when measuring sliders and cutters as well. Sliders tend to be closer to zero inches while cutters are generally between 5 and 15 inches. Usually fastballs and curveballs with large IVB have higher spin efficiencies as well. Sliders generally have very little (closer to zero) IVB and very low spin efficiency. You could also categorize IVB into spin rate as this is part of the “useful movement” you’re looking for. IVB is also a huge part of the vertical approach angle.
HIGHEST HORIZONTAL BREAK (AVG.)
| Rank | Name | State | School | Class | Pos | HM (avg) | Velo Range | Spin Rate (avg) |
| 1 | Everett Grubbs | GA | Pickens County | 2027 | SS | 20.1 | 82.7-83.8 mph | 2197 rpm |
| 2 | Caleb Cahill | LA | Central | 2028 | RHP | 18.7 | 76.4-77.4 mph | 1806 rpm |
| 3 | Brooks Bumstead | LA | Dutchtown | 2027 | 3B | 18.2 | 77.8-79.6 mph | 1529 rpm |
| 4 | Rhylan Hamm | TN | Lewis County | 2029 | SS | 17.0 | 77.1-78.2 mph | 2009 rpm |
| 5 | Will Oliver | LA | Saint Paul's | 2027 | RHP | 17.0 | 86.7-87.6 mph | 2114 rpm |
| 6 | Henry Gumpert | CA | Oakmont High | 2028 | RHP | 17.0 | 79.6-80.6 mph | 2099 rpm |
| 7 | Keaton Brant | OK | Sallisaw | 2028 | LHP | -16.9 | 76.9-80.5 mph | 1767 rpm |
| 8 | Osvaldo Nunez | CA | Bishop Alemany | 2026 | RHP | 16.8 | 86.7-87.8 mph | 2200 rpm |
| 9 | Alek Leyva | AZ | Catalina Foothills | 2026 | RHP | 16.7 | 81.8-84.1 mph | 2020 rpm |
| 10 | Ayden Dawson | CA | Rio Americano High | 2028 | SS | 16.5 | 76.7-79.1 mph | 2120 rpm |
Horizontal Break: Outlined on TrackMan’s own website: “... horizontal movement is measured in inches between where the pitch actually crosses the front of home plate side-wise, and where it would have crossed home plate side-wise if had it traveled in a perfectly straight line from release. A positive number means the break was to the right from the pitcher’s perspective, while a negative number means the break was to the left from the pitcher’s perspective.”
BREAKING BALL
SPIN RATE (AVG.)
| Rank | Name | State | School | Class | Pos | BB | Velo Range | Velo Range |
| 1 | Landon Richter | TX | Legacy Ranch | 2028 | RHP | 2780 | 68.1-69.5 mph | - |
| 2 | Logan Crawford | OK | Charles Page | 2028 | 1B | 2756 | 79.7-80.5 mph | - |
| 3 | Kahne Andrews | LA | Oak Forest Academy | 2028 | RHP | 2652 | 73.2-74.0 mph | 77.6-78.6 mph |
| 4 | Peyton Landry | DO | West Feliciana | 2027 | SS | 2608 | 69.7-72.9 mph | 70.3-71.4 mph |
| 5 | Ory Titus | LA | Jewel M. Sumner | 2027 | RHP | 2541 | 71.6-72.8 mph | 74.0-76.4 mph |
| 6 | Caden Brackett | CA | Loyola High | 2028 | OF | 2540 | 66.9-67.7 mph | 71.1-73.8 mph |
| 7 | Chandler Parker | LA | Doyle | 2029 | SS | 2498 | 71.7-73.7 mph | - |
| 8 | Jacob Ogas | AZ | Mica Mountain | 2029 | 1B | 2470 | - | 61.1-64.1 mph |
| 9 | Brody Dryden | IL | Yorkville | 2027 | C | 2466 | - | 64.2-66.6 mph |
| 10 | Wyatt Young | CA | Sierra High | 2028 | RHP | 2456 | 72.2-73.9 mph | - |
(Kahne Andrews; 1/15/26)
INDUCED VERTICAL BREAK (AVG.)
| Rank | Name | State | School | Class | Pos | BB | Velo Range | Velo Range |
| 1 | Wyatt Young | CA | Sierra High | 2028 | RHP | -17.0 in | 72.2-73.9 mph | - |
| 2 | Landon Richter | TX | Legacy Ranch | 2028 | RHP | -16.5 in | 68.1-69.5 mph | - |
| 3 | Peyton Landry | DO | West Feliciana | 2027 | SS | -16.5 in | 69.7-72.9 mph | 70.3-71.4 mph |
| 4 | Hank O'Meilia | OK | Thomas Edison Prep | 2028 | RHP | 15.3 in | 61.6-63.3 mph | 68.5-72.5 mph |
| 5 | Ory Titus | LA | Jewel M. Sumner | 2027 | RHP | -15.2 in | 71.6-72.8 mph | 74.0-76.4 mph |
HORIZONTAL BREAK (AVG.)
| Rank | Name | State | School | Class | Pos | BB | Velo Range | Velo Range |
| 1 | Matthew Reyna | TX | South San Antonio | 2026 | RHP | -21.3 | - | 65.0-70.6 mph |
| 2 | Brody Dryden | IL | Yorkville | 2027 | C | -20.8 | - | 64.2-66.6 mph |
| 3 | Owen Soh-Tse | CA | Northgate High | 2027 | RHP | -20.6 | - | 66.1-69.7 mph |
| 4 | Henry Gumpert | CA | Oakmont High | 2028 | RHP | -19.8 | 66.2-67.2 mph | - |
| 5 | Ethan Knight | MS | Saltillo | 2029 | RHP | -19.7 | 61.6-64.0 mph | 61.8-64.7 mph |
CHANGEUP
SPIN RATE (AVG.)
| Rank | Name | State | School | Class | Pos | Spin Rate (avg) | Velo Range |
| 1 | Gage Dalferes | MS | Biloxi | 2027 | C | 2335 rpm | 71.6-72.4 mph |
| 2 | Justin Herd | GA | Etowah | 2028 | 3B | 2252 rpm | 74.7-76.3 mph |
| 3 | Jiazan Chanthavongsy | LA | Cecilia | 2028 | RHP | 2147 rpm | - |
| 4 | Michael Queen | GA | Blessed Trinity Catholic | 2029 | OF | 2080 rpm | 68.6-74.2 mph |
| 5 | Jacob Ogas | AZ | Mica Mountain | 2029 | 1B | 2009 rpm | 66.6-67.0 mph |
INDUCED VERTICAL BREAK (AVG.)
| Rank | Name | State | School | Class | Pos | IVB (avg) | Velo Range |
| 1 | Joshua Wesby | IL | Oswego East | 2027 | 1B | 20.0 in | 75.6-76.6 mph |
| 2 | Drew Kirby | IL | Paris | 2028 | 2B | 19.8 in | 72.3-74.3 mph |
| 3 | Harrison Havard | MS | George County | 2027 | C | 19.2 in | 77.0-79.4 mph |
| 4 | Jake Skelton | TN | Grace Christian Academy | 2028 | 1B | 19.0 in | 70.4-73.3 mph |
| 5 | Wyatt Young | CA | Sierra High | 2028 | RHP | 18.7 in | 73.0-75.4 mph |
HORIZONTAL BREAK (AVG.)
| Rank | Name | State | School | Class | Pos | HM (avg) | Velo Range |
| 1 | Everett Grubbs | GA | Pickens County | 2027 | SS | 23.4 | 76.8-78.1 mph |
| 2 | Drew Collins | LA | Southside | 2029 | RHP | 21.5 | 71.0-71.2 mph |
| 3 | Jiazan Chanthavongsy | LA | Cecilia | 2028 | RHP | 20.8 | - |
| 4 | Gunner Martinez | CA | San Marcos Senior High | 2028 | 3B | 20.7 | 67.1-67.4 mph |
| 5 | Kameron Roller | LA | Pineville | 2027 | 2B | 19.8 | 71.2-72.0 mph |
| 6 | Slade Bullock | MS | Seminary | 2027 | RHP | 19.2 | 69.9-71.9 mph |
| 7 | Eastin McBroom | IL | Newark | 2028 | RHP | 19.2 | 73.4-74.9 mph |
| 8 | Brooks Bumstead | LA | Dutchtown | 2027 | 3B | 19.1 | 71.6-72.9 mph |
| 9 | Owen Kuhl | TX | Boerne Champion | 2027 | OF | 18.5 | 76.8-78.6 mph |
| 10 | Nicholas McMahon | GA | Woodward Academy | 2026 | RHP | 18.3 | 71.1-73.3 mph |
Deceptive look at 2027 RHP/SS Everett Grubbs on the bump.
— Prep Baseball Georgia (@PrepBaseballGA) January 18, 2026
Whippy arm speed from a low slot and feel for the deep four-pitch mix.
FB: 83-84; (HM 22.8)
SNK: 83; (HM 24.9)
SL: 70-72; frisbees, 2500+ RPM
CH: 77-78; tunnels, (HM 26.2)
Looks poised to hold a key two-way role… https://t.co/mM9vgqRzex pic.twitter.com/9ulPRFtQrb
RELATED CONTENT