The Winter Pulse: February
March 5, 2026

Throughout this winter showcase season, we’ll be taking the time to put into perspective the highlight-worthy performances that elevate prospects from our open Preseason ID events into need-to-know prospects within their regions or even the entire nation.
So, in this series, we’ll be spending some time highlighting the prospects who participated in recent Preseason ID events and performed like some of the best players in their backyards.
UPCOMING PRESEASON ID EVENTS
| Date | Event | Location |
| Saturday, March 7 | North Dakota PID | Fargo, ND |
| Saturday, March 7 | South Milwaukee PID | Racine, WI |
| Sunday, March 8 | Twin Cities PID | Savage, MN |
| Saturday, March 14 | Eau Claire PID | Lake Hallie, WI |
| Saturday, March 14 | Southern Indiana PID | New Albany, IN |
| Saturday, March 14 | Evansville PID | Evansville, IN |
| Sunday, March 15 | Madison PID | Windsor, WI |
| Saturday, March 21 | Milwaukee PID | Franklin, WI |
| Sunday, March 22 | Central Wisconsin PID | Mosinee, WI |
Find more upcoming Prep Baseball events here.
The leaderboards below contain statistics from the 66 Preseason ID-branded showcases that took place during the entire month of February that spanned the entire country.
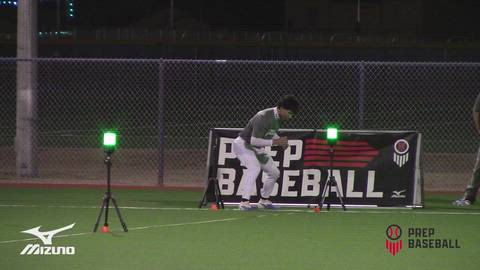
TOP 60-YARD DASH
| Rank | Name | State | School | Class | Pos | 60-yd. |
| 1 | Marco Montesanti | NV | Shadow Ridge | 2027 | SS | 6.44 |
| 2 | Malcolm Donaldson | IL | Lincoln-Way East | 2028 | OF | 6.52 |
| 3 | Chace Staude | WI | Kettle Moraine | 2027 | OF | 6.56 |
| 4 | Bryce Valls | NY | Chaminade | 2027 | OF | 6.58 |
| 5 | Logan Peterson | WI | Pewaukee | 2027 | OF | 6.59 |
| 6 | Dillon Herling | WI | Franklin | 2027 | OF | 6.60 |
| 7 | Jayden Gigante | NY | H. Frank Carey | 2026 | OF | 6.62 |
| 8 | Jordan Meeker | IA | Muscatine | 2026 | OF | 6.64 |
| 9 | Jaxon Wepking | WI | Verona Area | 2027 | OF | 6.65 |
| ^ | Rogan Bailey | IN | Warsaw Community | 2028 | SS | 6.65 |
| ^ | Keenan Dolan | NV | Bishop Manogue | 2026 | RHP | 6.65 |
| 10 | Ryan Espinoza | IN | Hanover Central | 2028 | OF | 6.66 |
(Marco Montesanti; 2/11/26)
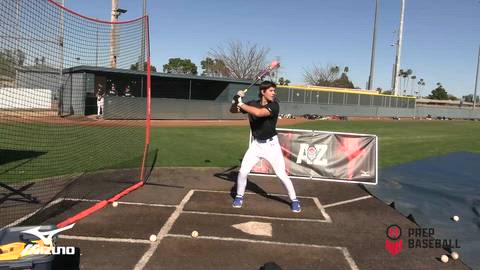
TRACKMAN HITTING LEADERS
EXIT VELOCITY (MAX)
| Rank | Name | State | School | Class | Pos | Exit Velocity (max) | Sweet Spot % |
| 1 | Parker Clubb | KS | Mulvane | 2026 | C | 108.9 mph | 44 % |
| 2 | Carter Taldo | KS | Olathe West | 2027 | OF | 107.2 mph | 87 % |
| 3 | Grayson Fontaine | PA | North Penn | 2028 | 1B | 106.9 mph | 45 % |
| 4 | Oliver Gibson | IL | Downers Grove North | 2027 | OF | 106.8 mph | 63 % |
| 5 | Karson Wiskur | MO | Smith-Cotton | 2028 | 3B | 106.3 mph | 62 % |
| 6 | DJ Brokaw | ID | Middleton | 2026 | OF | 106.1 mph | 61 % |
| 7 | Cooper Schaefgen | WI | Oconomowoc | 2027 | 3B | 106.1 mph | 71 % |
| 8 | Mason Cevette | PA | Cedar Crest | 2028 | RHP | 105.8 mph | 58 % |
| 9 | Tim Pirone | PA | Franklin Regional | 2028 | OF | 105.8 mph | 41 % |
| 10 | Tyler Ryan | PA | Malvern Prep | 2028 | OF | 105.7 mph | 33 % |
| 11 | Ryan Wilberding | IL | Libertyville | 2027 | C | 105.6 mph | 72 % |
| 12 | Bam Fenter | ID | Coeur D'Alene | 2026 | 3B | 105.5 mph | 36 % |
| 13 | Markus Jones | PA | Salisbury | 2027 | 3B | 105.5 mph | 41 % |
| 14 | Jackson Maddix | PA | Bishop Canevin | 2027 | LHP | 105.3 mph | 58 % |
| 15 | Cam Rakaczewski | PA | Greencastle-Antrim | 2028 | SS | 105.2 mph | 66 % |
(Carter Taldo; 2/14/26)
EXIT VELOCITY (AVG.)
| Rank | Name | State | School | Class | Pos | Exit Velocity (avg) | Sweet Spot % |
| 1 | Zayden Peltz | AZ | EVIT-Chandler | 2027 | OF | 100.6 mph | 42 % |
| 2 | Carter Taldo | KS | Olathe West | 2027 | OF | 100.2 mph | 87 % |
| 3 | Ayden Boyd | ID | Bishop Kelly | 2026 | OF | 99.7 mph | 50 % |
| 4 | Karson Wiskur | MO | Smith-Cotton | 2028 | 3B | 99.2 mph | 62 % |
| 5 | Jack Tooke | ND | Mandan | 2027 | RHP | 98.8 mph | 42 % |
| 6 | Michael Schaffer | PA | Episcopal Academy | 2028 | RHP | 98.7 mph | 70 % |
| 7 | Grayson Fontaine | PA | North Penn | 2028 | 1B | 98.4 mph | 45 % |
| 8 | Layne Rider | PA | Grove City Area | 2027 | 3B | 98.2 mph | 33 % |
| 9 | Collin Crumrine | IL | Normal Community | 2028 | 3B | 98.2 mph | 58 % |
| 10 | Cooper Schaefgen | WI | Oconomowoc | 2027 | 3B | 97.7 mph | 71 % |
| 11 | Markus Jones | PA | Salisbury | 2027 | 3B | 97.6 mph | 41 % |
| 12 | Aidan Gamble | PA | Downingtown West | 2028 | 1B | 97.6 mph | 20 % |
| 13 | Spencer Deitz | NV | Damonte Ranch | 2026 | 1B | 97.3 mph | 68 % |
| 14 | Kael Wischmeier | IA | Mediapolis | 2027 | 3B | 97.0 mph | 80 % |
| 15 | Mason Cevette | PA | Cedar Crest | 2028 | RHP | 97.0 mph | 58 % |
Exit Velocity: This metric measures the speed of the ball, measured in miles per hour, as it comes off the bat at the moment of contact.
Sweet Spot percentage: This metric is determined by how often the player produces a batted ball during the session with a launch angle between 8 to 32 degrees.
(Zayden Peltz; 2/1/26)
BLAST MOTION LEADERS
BAT SPEED (AVG.)
| Rank | Name | State | School | Class | Pos | Bat Speed (avg) |
| 1 | Jimmy Amplo | PA | The Shipley School | 2027 | OF | 82.7 mph |
| 2 | Ethan Flavel | WA | Decatur | 2027 | 3B | 79.7 mph |
| 3 | Gavin Greene | CO | Legacy | 2027 | 3B | 79.4 mph |
| 4 | Aiden Herner | ND | Century | 2027 | OF | 79.0 mph |
| 5 | John DiLandri | NV | Homeschool (NV) | 2028 | OF | 78.8 mph |
| 6 | Hunter Mason | IN | Sullivan | 2027 | 3B | 78.3 mph |
| 7 | Tim Pirone | PA | Franklin Regional | 2028 | OF | 78.1 mph |
| 8 | Penn Joyce | NC | Cary | 2028 | OF | 78.1 mph |
| 9 | Brayden Leavitt | NV | Shadow Ridge | 2027 | OF | 77.8 mph |
| 10 | Kaeden Chapman | OR | McMinnville | 2026 | 1B | 77.7 mph |
| 11 | Alex Shaffer | PA | Annville Cleona | 2027 | 3B | 77.4 mph |
| 12 | Max Wiginton | IL | McHenry | 2027 | 1B | 77.4 mph |
| 13 | Jacob Todd | KY | George Rogers Clark | 2027 | C | 77.3 mph |
| 14 | Adam McDowell | PA | Conestoga Valley | 2027 | OF | 77.1 mph |
| 15 | Anthony Rochford | IN | Chesterton Senior | 2027 | OF | 77.0 mph |
Bat Speed: The observed speed of the sweet spot of the bat at impact. The sweet spot of the bat is measured six inches from the tip of the bat.
(Aiden Herner; 2/21/26)
ROTATIONAL ACCELERATION (AVG.)
Body Rotation: A swing that has the appropriate relative contributions of body and bat rotations is an efficient and Powerful swing that maintains proper sequencing. An efficient baseball swing is one in which the body creates the initial movements, which is then transferred to the arms and out to the bat, thereby maximizing Bat Speed through this proximal-to-distal kinematic sequencing movement pattern.
(Chase Mitcheltree; 2/14/26)
VIZUAL EDGE LEADERS
EDGE SCORE
The Edge Score is a comprehensive score out of 100 that takes the core-six visual skills into account, providing athletes, parents, coaches and scouts with a benchmark number for assessing an athlete’s overall visual ability. In general the higher the Edge Score, the higher chance of athletic success. Think of the Edge Score as the 'Sixth Metric' in the standard Five-Tools that make up a ball player.
The average Edge Score for the 2020 MLB Draft Class was 79.3 (of hitters who completed a Vizual Edge test). MLB players we've worked with typically show stronger scores, with elite hitters scoring consistently above 87.0 on their Edge Score.
(Cameron Klene; 2/16/26)
TRACKMAN PITCHING LEADERS
FASTBALL
VELOCITY (MAX)
(Brooks Robinson; 2/7/26)
HIGHEST SPIN RATE (AVG.)
Max Fastball Velocity: This metric calculates the speed of the pitch as it’s released from the pitcher’s hand.
Average Spin Rate: This metric calculates the rate of spin on the baseball as it leaves the pitcher’s hand, measured in revolutions per minute (rpm). Historical data shows that high-spin fastballs lessen the impact of gravity, allowing for more ‘rise’ (or less fall, in other words) as it carries through the zone. Low-spin fastballs typically indicate the pitch has greater horizontal action, often making it tougher to square up, but generally easier to make contact with, leading to more ground balls, while high-spin fastballs show a correlation with swings and misses.
(Ian Crabb; 2/16/26)
HIGHEST INDUCED VERTICAL BREAK (AVG.)
Induced Vertical Break: Used in short form as "IVB," this metric is most important on fastballs for creating rise and on curveballs for creating depth – it can also have some use when measuring sliders and cutters as well. Sliders tend to be closer to zero inches while cutters are generally between 5 and 15 inches. Usually fastballs and curveballs with large IVB have higher spin efficiencies as well. Sliders generally have very little (closer to zero) IVB and very low spin efficiency. You could also categorize IVB into spin rate as this is part of the “useful movement” you’re looking for. IVB is also a huge part of the vertical approach angle.
(Nate Larson; 2/14/26)
HIGHEST HORIZONTAL BREAK (AVG.)
Horizontal Break: Outlined on TrackMan’s own website: “... horizontal movement is measured in inches between where the pitch actually crosses the front of home plate side-wise, and where it would have crossed home plate side-wise if had it traveled in a perfectly straight line from release. A positive number means the break was to the right from the pitcher’s perspective, while a negative number means the break was to the left from the pitcher’s perspective.”
(Shae LaBlance; 2/16/26)
BREAKING BALL
SPIN RATE (AVG.)
(Will Evert; 2/14/26)
INDUCED VERTICAL BREAK (AVG.)
(Creed Price; 2/8/26)
HORIZONTAL BREAK (AVG.)
(Wyatt Hansen; 2/14/26)
CHANGEUP
SPIN RATE (AVG.)
INDUCED VERTICAL BREAK (AVG.)
(Lucas Fisher; 2/7/26)
HORIZONTAL BREAK (AVG.)
(Christian Walania; 2/16/26)